Maintaining a Reproducible Database on Political Parties, Elections, and Governments
Werner Krause and Dag Tanneberg
This chapter appears only in the online appendix of the book The Practice of Reproducible Research. Please cite this online version of the book as: Kitzes, J., Turek, D., & Deniz, F. (Eds.). (2018). The Practice of Reproducible Research: Case Studies and Lessons from the Data-Intensive Sciences [Online Version]. Retrieved from http://practicereproducibleresearch.org.
Our names are Werner Krause and Dag Tanneberg. We graduated in Political Science with a focus on Comparative Politics. Currently, we are pursuing our doctoral degrees at the research department "Democracy and Democratization" located at the WZB Berlin Social Science Center, Germany.
Much of the research at our department revolves around political competition, elections, and the dynamics of democratic government. In the mid-1990s senior fellows of our department decided to set up a permanent infrastructure offering data on elections and governments to all department members in a standardized and easily accessible format. Originally, the data were used to observe and analyze the consolidation processes in the then still young Eastern and Middle European democracies. The project has since grown into a database that includes more than eighty countries around the world between 1945 and today.
The database tracks numerous aspects of political competition. For instance, we code lower house and presidential election results, government duration, cabinet size and composition as well as the ebb and flow of electoral alliances between political parties. Department members may output raw data and digitized copies of our primary sources. Alternatively, summary statistics such as turnout, the effective number of parties, measurements of disproportionality or government stability can be obtained from the database. Unfortunately, the database is not openly accessible yet. However, the plan is to go public by the end of 2017.
Back in 2011 and 2008 we were recruited as research assistants to continue this longstanding project. We introduced several substantive and technological innovations into the database that sum to more streamlined, less error prone coding and data management routines. It was our goal to ensure transparency and reproducibility from the point of coding individual parties in single elections to the moment of generating summary statistics on every election covered between 1945 and today.
Broadly speaking, we define reproducibility as the responsibility to provide sufficient detail on scientific research such that others using the same data and methods will be able to replicate published results. Those may be single statistics, graphs, tables or even entire articles. Results that cannot be reproduced are neither open to critique nor revision - they are unscientific.
In the context of our database reproducibility becomes even more demanding. Since the quality of the data stored in our database affects numerous ongoing projects in and outside of our department every single piece of information should be reproducible. The challenge is thus to make the acquisition and coding of primary data as transparent to others as the standardized output we provide for secondary analyses.
Workflow
 Our team consists of one research assistant, two junior researchers, and one senior fellow. The research assistant is responsible for coding and entering the data. Moreover, she performs some baseline consistency checks. The junior researchers oversee both automated consistency checks and data processing. The senior fellow supervises the project. We confront three basic challenges when collecting, coding, and processing data: a) to reduce coding errors, b) to maintain a high degree of intercoder reliability, and c) to provide transparency on the entire decision-making process. Each is discussed in the following.
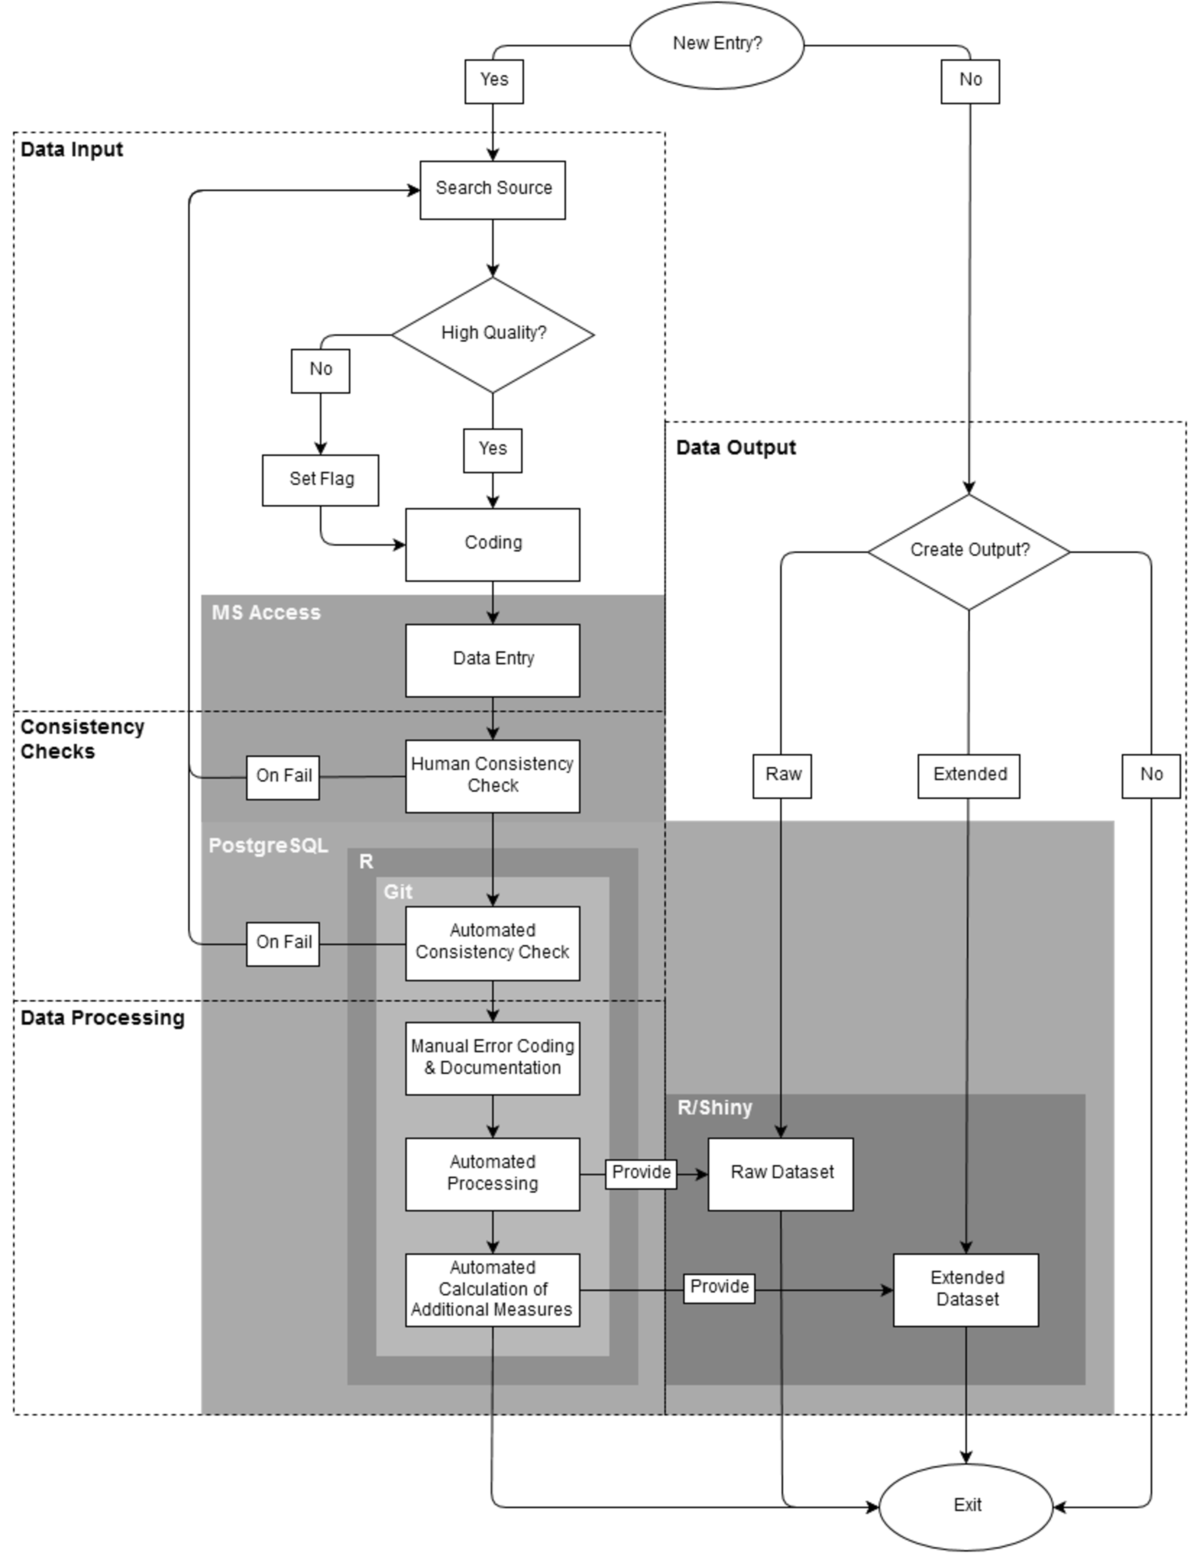
Our workflow has four separate steps. First, data have to be acquired and coded manually. Second, codings go through different human supervised and automated consistency checks. Third, the newly generated data are processed before storing them in our back-end database. Finally, information can be outputted from our database. Technically, each step is independent of all others.
First, our research assistant collects information on all upcoming elections and governments in the 82 countries covered by our database. Once a new observation is to be added to the database the assistant will compile sources on party histories, election results and/or government events. At this point it is crucial to critically evaluate the quality of a source. It must be factually correct and should offer information that is as disaggregated as possible. Both requirements are driven by the goal of correct and reliable coding. To ease the burden on the research assistant a list of high quality print and digital sources is included in a detailed codebook that accompanies the database. If high quality sources are unavailable, information from other documents will be accepted on a preliminary basis. Such entries are flagged, however, in order to update them once high quality sources become available. For example, elections will be flagged if results are available as vote and seat shares only rather than absolute numbers. Once a source has been identified it is coded manually following the guidelines of codebook.
Next, the research assistant enters the coded data into a Microsoft Access front end, and she saves a digital copy of the source (including all coding decisions) on a server that is accessible to all users. Access is neither free nor open, but it can be easily maintained and, more importantly, offers a user interface that makes data entry clear and easy. Via forms and reports the Access interface provides a standardized environment that reduces human error and increases intercoder reliability. Moreover, the Access interface performs basic consistency checks which enable the research assistant to evaluate the reliability of the selected sources. One such routine verifies that the sum of absolute votes equals the total number of valid votes as stated in the source. Another routine compares the total seat share of all government parties to the coded type of government. For example, minimum-wining coalitions with less than 50 per cent of the seats in parliament are immediately identified as problematic. Should any consistency check fail new sources have to be consulted in order to reach an almost error-free result.
After the data has been entered it is automatically exported to a PostgreSQL database. The database allows us to store the entire dataset and to put it under version control using Git. Changes to the database are documented on a daily basis and more complex automated consistency checks are performed at the same time. Those make use of the open source statistical software R. Using the R package knitr test results are saved and sent as pdf to one of the junior researchers. Those reports document all new entries, but also all additional changes to the data, and all failed consistency checks. Consequently, the work of our research assistant can be easily monitored and potential coding errors are almost immediately spotted.
The automated reports serve as a basis for a manual classification and documentation of errors. Despite our best efforts to collect data only from high quality sources, certain inconsistencies are unavoidable. For example, sometimes we cannot identify the number of seats in parliament controlled by a coalition government. This happens when government parties competed in different electoral coalitions for which seats won by each party are not reported. R automatically identifies these and other cases more. Due to the wild variety of potential inconsistencies all suspicious entries are flagged and must be documented manually.
Finally, the data are processed in R. An R script joins data from several tables and generates a raw dataset which includes all entries of the database. Additional operations are run on the raw data to generate an extended dataset. This second dataset includes summary statistics such as turnout, the effective number of parties, etc.
After all these steps are finished we make both datasets accessible via Shiny. This interface allows users to browse and download raw as well as processed data. It is also possible to export the entire database including all coding decisions and flags.
Pain points
Coding and documenting cases that do not fit our pre-defined coding scheme constitute one particular pain point. For example, in many countries political parties and electoral alliances do not resemble the "well-behaved" party systems of Western Europe. Frequently changing electoral alliances, electoral pacts at the local level or the implosion of entire party systems as in Italy in the mid-1990s confront us with serious difficulties. Often identifying, coding, and documenting the electoral performance of political parties on a continuous basis is daunting. Moreover, those problematic cases come in so many variations that it is almost impossible to capture them in a parsimonious set of error codes. Therefore, no explicit rule is given in the codebook, and every individual case needs to be explained separately. The final datasets contain all that information. Hence, deviations from the coding guidelines are at least made transparent to the user.
A second pain point concerns the history of the database and inter coder reliability. Often the current research assistant knows only a limited number of her predecessors. Consequently, there is little guarantee that coding decisions are made consistently across coder generations. Rather, each research assistant acquires highly individualized knowledge of coding decisions and problems which can never be communicated exhaustively between coder generations. In other words, although an extensive codebook exists intercoder reliability is necessarily limited. As a consequence, one recurrent task is to review past codings in order to guarantee that information in our database stays consistent over time.
Key benefits
One central concern of our workflow is to make data collection and processing transparent to the user. While numerous datasets on election results, government formation, and electoral systems exist, none document the coding process down to the level of the original source. In contrast, we provide users with a codebook listing all standardized coding decisions. Individual entries that do not fit those guidelines are highlighted and explained in the database output. Moreover, we offer the user the opportunity to review our original source along with our coding decisions. There are many ways to collect and aggregate data on political parties, elections, and governments. However, only if a researcher is offered sufficient detail on the data and the decisions leading to its creation, will she be able to evaluate how idiosyncrasies of the data impact her results. Our approach combines transparency on sources, coding, and aggregation with different layers of consistency checks, error assessment, and continuous monitoring. It establishes a unique level of reproducibility in the field of Comparative Politics.
Key tools
The key tool of our workflow is the PostgreSQL database which allows us to efficiently store our data. In contrast to Microsoft Access, which we use as a user interface for data entry, PostgreSQL is an object-relational database management system that comes free of charge. For its compatibility with Microsoft Access, Git, and R it constitutes a very flexible tool. It allows to automatically produce periodic reports on changes to the database and failed consistency checks. Moreover, PostgreSQL enables us to access all versions of the database and the corresponding R scripts via the version control system Git. Hence, earlier versions of the database can quickly be restored allowing for the replication of data used in past analyses. PostgreSQL along with its compatibility with the mentioned tools enables us to ensure high levels of data quality and reproducibility.
The second tool that we want to highlight is the statistical programming package R. In contrast to most other software alternatives R is free. Although R has a steep learning curve, it is an excellent tool for data mining and analysis. Moreover, R enables us to process data and perform consistency checks automatically. Another important feature of R is that existing code can quickly be changed. For instance, additional summary statistics can easily be added to the datasets that we provide. Finally, R packages such as knitr and shiny complement our workflow. These packages allow us to create periodic reports on the dataset and to provide members of our department easy access to the data.
Questions
Why do you think that reproducibility in your domain is important?
Political scientists learn from empirical experience. If contributions to our field are not transparent enough to be reproduced, then nothing will be learned from them. However, reproducibility covers both data generation and analysis. The Garbage-In-Garbage-Out principle applies to all studies that fail on either side of the equation.
How or where did you learn about reproducibility?
Some practices we use are standard and should be taught in every introductory methods class. Others we learned from more tech savvy colleagues. Magic happened once we put the two together.
What do you see as the major challenges to doing reproducible research in your domain, and do you have any suggestions?
We see two major pitfalls. First, political scientists often receive strong training in qualitative or quantitative methods, but not in basic data management. It is not unheard of that graduate students merge datasets row by row in Excel. Much would be gained if Political Science curriculae would teach key data management skills. Second, our field rewards productivity, not thoroughness. We finish one project and quickly move on, leaving procedures of data generation and analysis poorly documented. To ensure at least a minimal level of reproducibility the provision of replication packages containing raw data, data management and analysis scripts should be made mandatory.
What do you view as the major incentives for doing reproducible research?
Political scientists learn from experience. Reproducible research establishes a baseline against which to compare future analyses and thus secures scientific progress.
Are there any best practices that you'd recommend for researchers in your field?
Never change your raw data file. Stay away from the GUI. Have at least one notebook detailing the evolution of your analysis. Always comment your code or field notes.