Detection and Classification of Cervical Cells
Daniela Ushizima
My name is Daniela Ushizima, I am currently a Staff Scientist at the Lawrence Berkeley National Laboratory and a Data Science Fellow for the Berkeley Institute for Data Science at the University of California, Berkeley. Much of my research work is in devising machine vision and pattern recognition algorithms as part of software tools for handling image-centric data, especially those arising from the Department of Energy imaging facilities. The case study I describe here illustrates the core steps in designing a machine vision algorithm to analyze a set of digital images and organize them according to the desired criteria. There are several image processing and analysis frameworks that encapsulate algorithms; this case study refers to the application of ImageJ, a powerful image analysis tool.
Workflow
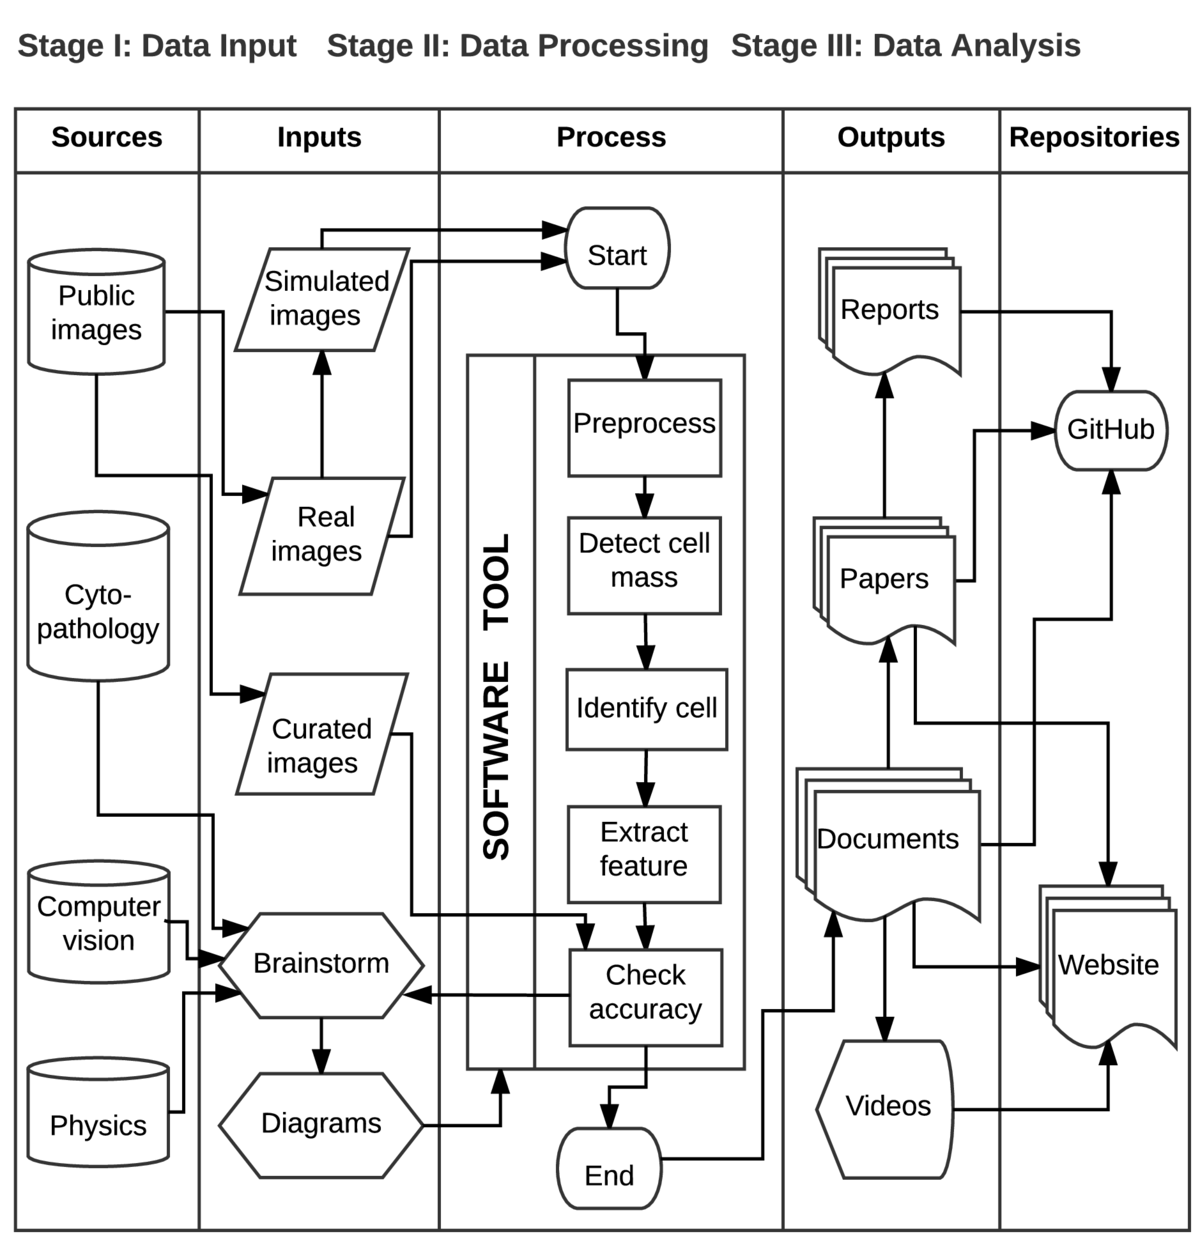 The workflow diagram follows a data model called SIPOC, which stands for suppliers, inputs, process, outputs, and customers; these correspond to the columns of the table. Here, we adapt SIPOC diagram to better represent our use-case, hence the first column is called sources and the final column represents repositories. The proposed workflow prioritizes the compartmentalization of different processing steps of the software tool, and hides potential feedback loops that might occur.
This diagram tells the story of research investigations among doctors, cyto-pathologists, physicists, and computer scientists, aiming to design, develop and deploy algorithms for improving the analysis of biomedical images. Some of the tasks include increasing the number of image fields under scrutiny in order to speed up the cell counting and recognition, comparison among cells, quantitative description of samples, to name a few.
Historically, this use-case began with brainstorming among pathologists, physicist and software engineers on how to provide scalable computer-aided analysis to the acquired large datasets of biomedical images, containing cervical cells. Communication and diagraming were fundamental sources of information to understand how to categorize types of cells and foresee limitations imposed by the datasets, such as cervical cell lineages, cell fragments, magnification and usable area within the image sample.
In order to develop analysis pathways, the team organized the datasets into three main input image sets: simulated, real and curated. A simulated image consists of several clipped real cells collated with different levels of overlapping, which facilitates algorithmic validation since the ground-truth is known a priori. A real image consists of a digital picture of a Pap smear slide, obtained at the light microscope -- these images often contain several types of cervical cells and other findings (e.g. bacteria, blood), and may be corrupted by noise and other artifacts, such as staining variations, dirt, hair, etc.
The core of this case study lies in the process column that illustrates the main steps in the machine vision algorithm. The preprocessing step transforms the samples into more compact and reliable representations of the image, for example, removing areas or eliminating the whole image if it is over-stained. This step includes essential image transformations, such as anisotropic filtering that preserves borders and smooths regions that compose a supposedly homogeneous image partition.
As part of the analysis, the software tool must detect the regions of the interest in each image, i.e., the cellular mass and the rest of the image. This step requires several iterations of the machine learning algorithm (statistical region merging) before it can correctly split the image into foreground and background. The next step is to separate the cellular mass into individual cells: by modeling simple biological prior knowledge, such as the relationship between nucleus and cytoplasm, the software tool is able to quickly estimate cytoplasm boundaries. After identification of the cells, feature extraction takes place, including nucleus-cytoplasm area ratio, convexity of cytoplasm contour, and other parameters that are relevant for identifying cell lineages. Finally, we use simulated and curated datasets to validate results, for example, considering sensitivity and specificity measures based on the number of pixels or the number of cells identified.
An important step of the data processing is keeping track of the outputs. The fourth column lists four main outputs of the system: technical reports, scientific papers, documentation about the software tool and educational material about the science problem and algorithm development. Although we omit outputs of partial results (checkpoints), they are very common and useful throughout the design of the analytic software tools.
The fifth column shows the different outputs being archived in repositories to enable access to the research discoveries, for example GitHub and websites. In the context of this case study, it indicates the main hubs of information distribution for the project.
Pain points
The software tool design and testing have required intense communication among the team members through reports and presentations. Although part of the team used version control, much of the code is still to be made available open-source through GitHub. In addition to commit messages, which tend to be short, we have also maintained an electronic diary of activities -- these were fundamental to keep the whole team synchronized and up to speed. The painful side of such an electronic lab book has been the unstructured format of the inputs that may require extra-time to parse.
Key benefits
The most reproducible part of this project has been the development of code allied to simulated datasets. This activity improved across the team, particularly due to the participation in code competitions, which forced the whole team to organize data sources and code repositories such that reviewers could quickly reproduce the results. In addition, keeping track of advancements in a common digital lab book helped in preparing manuscripts and other technical reports.
Key tools
An important tool has been ImageJ, a Java-based image processing software program, which was originally developed by Wayne Rasband at the National Institute of Health circa 1997. Although most of the ImageJ plug-ins focus on medical imaging, this framework has been widely used in other applications, such as material sciences.
Questions
What does "reproducibility" mean to you?
In the context of this case study, the work will be computationally reproducible when the software tools our team builds can also be used by the science domain experts, e.g. pathologists, who should be able to transform raw data files into quantifiable patterns, obtaining consistent results with previous/tested analyses. Because algorithmic parameters often change from a dataset to another, it can be challenging to get results with the same accuracy, given different datasets.
Why do you think that reproducibility in your domain is important?
Reproducibility is essential in quantitative microscopic because it can guarantee accurate measurements and improved quality control.
How or where did you learn about reproducibility?
Flow charts and code documentation improved grades during college, and their absence meant dire punishment: reproducibility once was a time-consuming protocol to get good grades and spend extra ribbon cartridge with my dot matrix printer. The tech-industry introduced me to version control, and TortoiseSVN and I started working together with several colleagues. Other softwares came along the way, such as git and Atlassianalgorithm to enhance usability and extension of the codes. After entering BIDS, reproducibility turned into a fun activity, a conversation starter and a never-ending code improvement process. Lots of concepts came together more systematically, particularly after attending Software Carpentry classes and becoming a instructor myself.
What do you see as the major challenges to doing reproducible research in your domain, and do you have any suggestions?
The major pitfalls of doing reproducible research in image analysis have been (a) the lack of domain-specific image examples that illustrate applicability of the algorithms, (b) dependency of packages that are not freely available, and (c) absence of documentation that enables understanding how/why the data transformations occurred.
What do you view as the major incentives for doing reproducible research?
The major incentives for doing reproducible research are the ability to replicate the experiments later, to fix and/or reuse code for different applications, to easily work in larger teams, and the potential for a broader impact, even with the help of collaborators you have never heard of.
Are there any best practices that you'd recommend for researchers in your field?
While there are no general rules, some tools can only help a person to reproduce work. In my opinion, they are: (a) use of version control, (b) practice of software quality assurance, (c) organization of data samples and code systematically, for example using Cookiecutter.
Would you recommend any specific resources for learning more about reproducibility?
Among the several options out there, Software Carpentry is certainly an important resource and the book Making Software by A. Oram and G. Wilson.