A Dissection of Computational Methods Used in a Biogeographic Study
K. A. S. Mislan
My name is Allison Smith, I am an ecophysiologist and my research focuses on organism-environment interactions in the ocean. In particular, I am interested in forecasting the effects of climate change on marine ecosystems.
I recently published research on the fundamental niche of pelagic animals in the global ocean. The study included a comparison of blood-oxygen binding characteristics of different species obtained from published papers. Thresholds for blood-oxygen binding characteristics were mapped in the ocean using gridded oceanographic data. My workflow details my process for obtaining and analyzing data for the project. In order to increase the reproducibility of the study, code used for the project was put in a long-term archive.
Research paper:\ Mislan, K. A. S., Dunne, J. P. and Sarmiento, J. L. (2016), The fundamental niche of blood-oxygen binding in the pelagic ocean. Oikos. https://doi.org/10.1111/oik.02650
Code archive:\ Mislan, K. A. S., Dunne, J. P. and Sarmiento, J. L. (2015). P50 Depth Analysis v1.0. Zenodo. http://dx.doi.org/10.5281/zenodo.31951
Workflow
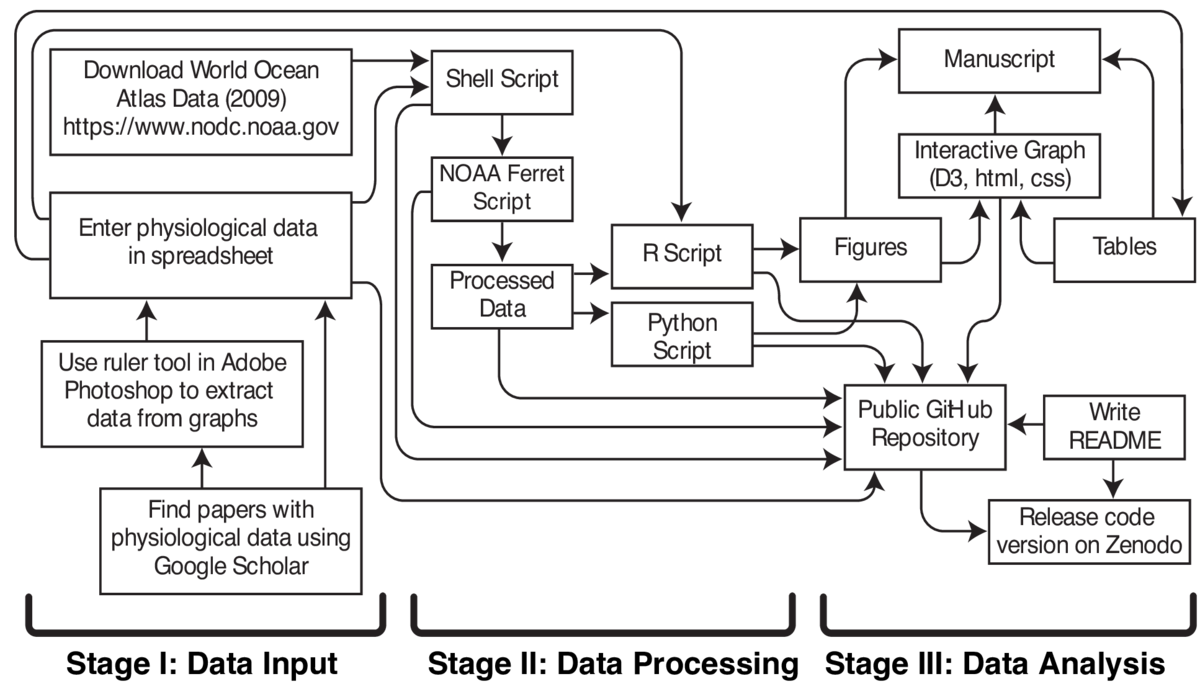 Obtaining data from existing resources was the first step. World Ocean Atlas 2009 (WOA09) data is publicly available through the National Oceanic and Atmospheric Administration (NOAA) National Centers for Environmental Information. The WOA09 data is on a geographic grid and available in several different file formats. I downloaded the network common data form (netCDF) file format. The NetCDF file format facilitates access and sharing of scientific data in arrays. There are many tools available to read and manipulate netCDF files. NOAA Ferret is publicly available software for visualization and analysis and has built-in functions designed for efficient processing of geographic data in netCDF file format. One of the objectives of the analysis was to vary two input parameters and determine the effect on geographic characteristics. I automated the process of creating NOAA Ferret scripts with different input parameters by writing a shell script that generated and processed NOAA Ferret scripts (.jnl files). The processed files were saved as netCDF files.
The physiological data were gleaned from published studies found through Google Scholar searches for key words. The data were extracted from the papers and put into a spreadsheet. The data of interest were often available in tables and the text of the papers. In some cases, the data were only available in scatter plots. The ruler tool in Adobe Photoshop was used to manually extract the data from plots. Once all the information from the studies was entered into the spreadsheet, the data from the spreadsheet were saved as a tab-delimited text file. The data were then read into R to determine parameters for the analysis of the oceanographic data. Additionally, the data were plotted in a scatter plot in R and each point in the plot had a number assigned to it. Information about the individual points was put into two tables. However, the numbers on the plot had to be matched to numbers in the two tables to get relevant information from the plot, which was inefficient. Therefore, I created a web-based interactive graph that embeds information from the tables into the scatter plot using a javascript library called Data-Driven Documents (D3). In the interactive graph, the information for each point is visible when the cursor is placed on the point. The interactive graph also includes options to select different legends for the graph that highlight additional groupings for the points. A link to the interactive graph was included in the publication.
R and Python were used to create the figures although it would have been possible to create all the figures in one or the other of these software packages. I learned R before Python so I tend to do most of my analysis in R because I am most familiar with it. However, I like the tools for making geographic plots in Python so I used Python to make the geographic plots. Then I wrote the paper.
Code is not usually included in the methods section of a paper due to space and formatting constraints. However, the code tells a much more complete story of my analyses. In order to prepare my code for archiving, I made some modifications. I created a folder structure that would make it easy for a user to find files. The folder structure included a folder for code, folders for input files to run the code, output files produced by the code, and graphs produced by the code. I annotated my code while I was writing it, but the annotations were usually short and meaningful only to me. Descriptive annotations were added to the code being archived. I also changed the file paths to be referenced solely within the folder structure (../../) so that the code would be independent of my home directories (/Users/kasmislan/code/project).
My code worked on my computer, but it might not work the same way on a different computer. For example, different operating systems have different methods for rounding numbers. I generated output files for my code on my computer and moved the files to the test files folder. Then I wrote a script that automatically compares output files produced by another user using my code on another operating system to the test files I produced using my code on my operating system. If there are differences, then a user will be able to identify and address them.
The most critical step for archiving my code was writing the documentation (README file). The documentation includes a description of the purpose of the code, references to research articles, a list of software dependencies including versions, clear step-by-step instructions on how to use the code, and clear step-by-step instructions on how to use the test files. I also included a section to acknowledge my funding sources and others who helped with the project.
The final step was to submit the code with the Massachusetts Institute of Technology (MIT) License to Zenodo, a long-term archive. The MIT License has few restrictions which maximizes that ways in which my code can used and adapted by others. I sent the link to the code archive to the journal so that it could be included in the publication.
Pain points
My primary pain point is that archiving my code takes additional time after I am ready to submit a scientific paper. The most time-consuming steps are associated with making the code usable by someone else on their own computer. As I wrap-up a project, my files are cluttered because I have an exploratory phase as I am analyzing data where I write code that is not ultimately used for the results presented in the paper. I have to identify and organize the relevant code files. Then I have to modify filepaths, annotate the code, create test files, and write a README file with instructions for using the code which also takes additional time. Another pain point is trying to find someone to test the code to make sure that the instructions are comprehensible, and the code runs on other computers and operating systems without errors. This step requires another person to spend time to help me archive my code. In the current scientific research system, archived code is not valued as highly as scientific papers so the extra time spent by scientists and code testers to archive code does not directly translate into greater scientific success. Some academics have hypothesized that papers with archived code are cited more often, but this has not been universally verified. In my experience, my archived code is limited to a specific analysis and, while the availability of code may increase the confidence of the scientific community in my results, I do not think that my archived code is generating more citations of my scientific papers.
Key benefits
Reproducibility has always been an important component of research in my field. In the past, instructions for reproducing research were put in a methods section in journal articles. The increasing importance of code in my field is changing the way reproducibility is accomplished because it is not possible to include code in a methods section. However, it is necessary to have access to the code to reproduce the research.
Key tools
I have always believed that making my code available is important, but, until recently, I was not sure how to do it. GitHub is a "game-changer" for sharing code with others in a reliable, consistent, and discoverable way. After I was introduced to GitHub, I was able to start archiving my code. My code is posted to GitHub and a permanent copy and digital object identfier (doi) are generated by Zenodo.
There are specific instructions on GitHub for releasing code to Zenodo:
https://guides.github.com/activities/citable-code/
Questions
What does "reproducibility" mean to you?
Reproducibility means that sufficient descriptive information and resources are provided for someone to be able to repeat the same study. As part of my research as a scientist, I write code to manipulate and visualize large quantities of data to obtain results. I believe that my code should be adapted and made available so that it is usable by others in my field.
Why do you think that reproducibility in your domain is important?
Reproducibility has long been a central tenet of the scientific research process in my field because data from new studies are compared to data from earlier studies. Not so long ago, all the data collected during a study were included in published research articles, and the analyses could be easily described in a materials and methods section of the articles. Recent increases in the quantity of data and the concurrent increase in the complexity of the analyses has made it impossible to include the data itself or the same level of descriptive detail in the materials and methods sections of research articles. I think that my domain values reproducibility but the current format for publishing research articles is not able to fully accommodate the modern scientific research process.