Generation of Uniform Data Products for AmeriFlux and FLUXNET
Gilberto Pastorello
I'm Gilberto Pastorello, a Research Scientist at Lawrence Berkeley National Laboratory, doing research on life-cycle management of scientific data, encompassing data and metadata structures and linkages, data quality and data uncertainty quantification, and end-to-end data systems. The part of my work described here involves development of data processing pipelines and data management solutions within the environmental domain. This work is done for the AmeriFlux and FLUXNET research networks.
Workflow
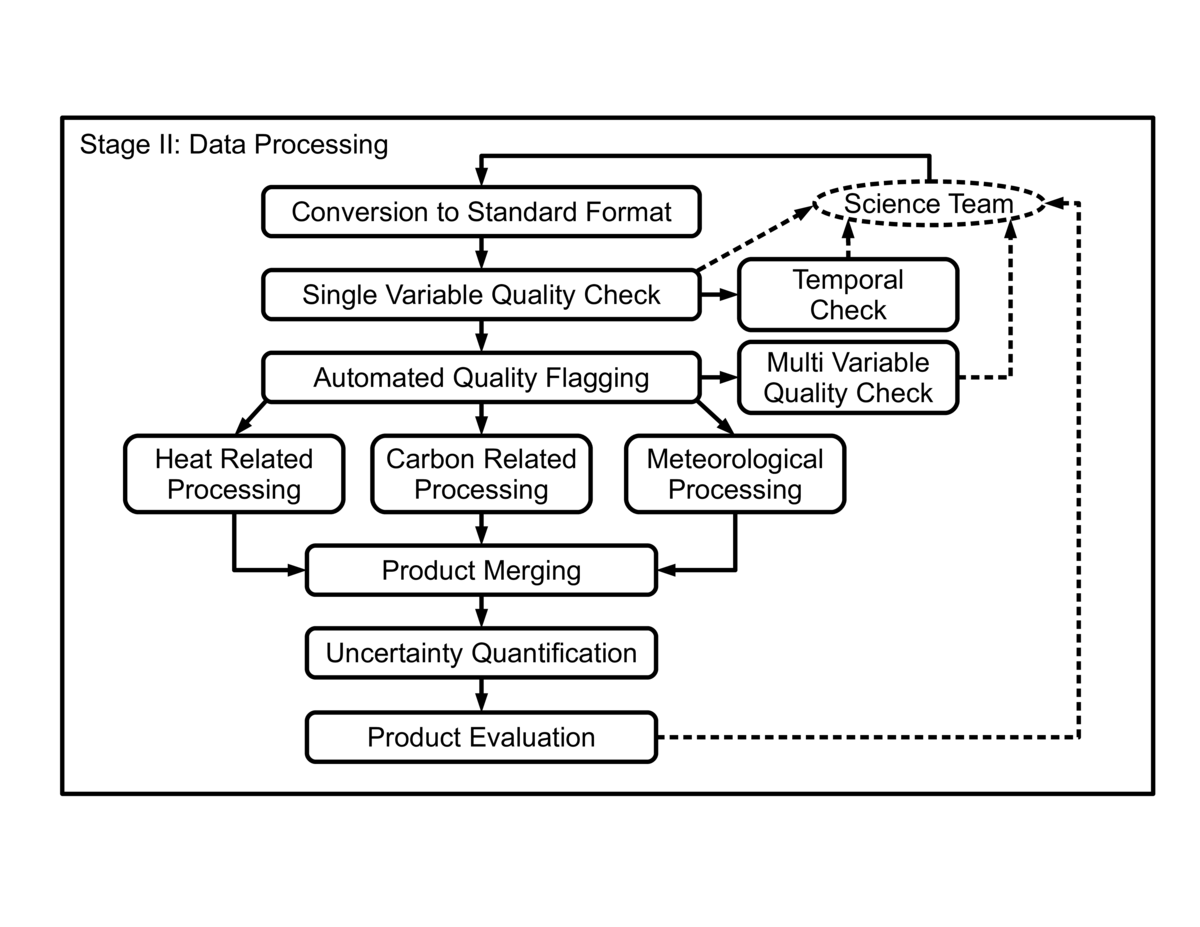 Multiple Science Teams collect carbon, water, and energy fluxes from over 800 field sites across the world. Currently, more than 400 of these sites share their data with regional networks such as AmeriFlux, allowing the creation of data products with a global scope for the FLUXNET network, such as the FLUXNET2015 dataset. These sites are operated independently and methods for data collection, processing, and data quality control by the Science Teams can vary significantly. Our workflow aims at processing these heterogeneous datasets to generate data products that are comparable across these sites. A general view of the steps in our workflow is shown in the figure. In this context, reproducibility is strongly related to identifying and documenting data quality control checks, parameterizations for processing, sequences of correction steps, and data filtering.
The pipeline is executed every time new data are sent to us by the Science Teams. We keep track of multiple submissions with a combination of simple incremental counters for versions and timestamps -- logs of data transfers are stored in a relational database. The frequency of data submissions can range from daily to yearly updates from a Science Team. All executions of the pipeline generate a version, with successful executions being made public after being vetted by the Science Teams.
The first few steps are related to data quality and aim at identifying serious quality issues and making data quality more uniform across sites. Specialized algorithms and visualization methods are used in these steps. Automated generation of flags and manual inspection of datasets are done first, followed by the compilation of metrics about the data and checks. Any decision to change the datasets is first shared with the Science Team and confirmed before being executed. Major issues are identified and solutions are developed in collaboration with Science Teams. A custom issue tracking system developed by us is used to keep track of interactions with Science Teams and the issues being addressed in the datasets. The information in this issue tracking system is private and accessible only to our team and the Science Team for the field site providing the data, but reports and status information from this system can be made available with a published data product. Changes to data are also documented in log files and quality flags that are added to the datasets themselves, these being made available along with data products. Changes and corrections generate a new version of the input data and the pipeline starts again from this new version.
The central portion of the workflow includes the processing steps for heat, carbon and micrometeorological variables. The parameters used to configure these executions are stored with the datasets, and specialized checks are also executed within each step. The results from most of these checks are stored as quality flags added to the datasets. Versions of the code used for these steps are also recorded in the dataset's metadata.
The product merging step reformats the data into common structures and combines quality information into quality flags at a higher level of abstraction, to simplify using the datasets. The uncertainty quantification step generates quantiles representing uncertainty intervals originating from each of the processing steps, also becoming part of the data products.
The more multiple team members understand and can generate products, it is much more likely that problems will be identified early, questions from external members of the community will be answered more easily, and funding agencies will have documented product releases (data and software), which can be combined with other types of publications in assessments of scientific impact.
Pain points
The execution of this pipeline can happen several times before acceptable results are reached, and it also includes several interactions with the Science Teams potentially resulting in changes to the input datasets. The changes can be applied by the Science Teams or by our team. With multiple iterations, the changes that are needed to make a dataset correct are often spread across many versions of the input data. Consolidating these changes is particularly difficult, especially when the changes were applied to versions leading to unsuccessful runs.
More specifically, one version related challenge is keeping versions consistent across multiple processing instances. We use mapping of versions of inputs to outputs, but with outputs influencing what a new version of the dataset looks like, these mappings are not always straightforward.
Another challenge is related to the multi-source nature of our datasets. Many of these datasets span over a decade of data collection, processing, and curation by multiple people. Since the teams are distributed and follow potentially different data collection and processing protocols, fully automated reproducibility is difficult to be achieved. A workaround has been to document the choices in collection and processing data in such cases.
Finally, combining reproducibility issues with credit issues for datasets is another challenge. Giving proper credit to data providers and data processors/curators is an essential part in large data sharing efforts. Comprehensive data sharing policies help with assigning proper credit. Multiple versions of the datasets are created over time, and close communication with the Science Teams is important to allow tracking all contributors.
Key benefits
Without the use of versioning and issue tracking coordinated between code and data, it would be unfeasible to fully document choices for the datasets, many of which affect important aspects such as data quality or uncertainty.
Key tools
Data and software versioning are certainly the main practices adopted in this case study. We are currently assigning versions to data and software in a coordinated way, to allow assessment of changes to data and code. We use a private Subversion server for code version control. We developed a custom Web-based system called FIT (Flux Issue Tracking) for tracking the interactions with Science Teams and data quality issues for datasets. FIT was later also adapted for tracking code related issues. It was implemented in Django/Python using PostgreSQL databases.
For the processing pipeline, we combine specialized code written multiple languages. Automated quality checks and data product generation steps mostly use C implementations, with a couple of steps implemented in Python and MATLAB; visual data quality checks are implemented in MATLAB and Python; and driving code and generation of final data products is done using Python, with extensive use of the NumPy and SciPy packages.
Questions
What does "reproducibility" mean to you?
For this case study, reproducibility means being able to apply standard methods to process heterogeneous datasets to generate comparable data products. The data sources for our processing are distributed across very different ecosystems, with data acquired, processed, and quality checked by different teams. The data products we generate from these datasets need to be in the same scales and have comparable levels of quality, representativity, etc.
Are there any best practices that you'd recommend for researchers in your field?
While version control is widely adopted for software code, this is not necessarily the case for data. Consistently keeping track of versions of a dataset at a minimum helps with data changes and is well worth the extra effort. Another lesson we learned early was that issue/bug tracking ideas and tools can simplify data management activities, and can also be valuable in building the history of a dataset and generating its documentation.
Would you recommend any specific resources for learning more about reproducibility?
While not always featuring fully developed practices or tools, reproducibility scientific events (and their published proceedings) often showcase new and interesting ideas. Events featuring latest research in provenance include, for instance, the International Provenance and Annotation Workshop (IPAW) and the International Conference on eScience.