Developing R Code for the Processing and Analysis of Optic Flow Data
Andrea R. Seisler and Rick O. Gilmore
This chapter appears only in the online appendix of the book The Practice of Reproducible Research. Please cite this online version of the book as: Kitzes, J., Turek, D., & Deniz, F. (Eds.). (2018). The Practice of Reproducible Research: Case Studies and Lessons from the Data-Intensive Sciences [Online Version]. Retrieved from http://practicereproducibleresearch.org.
My name is Andrea Seisler and I am the lab manager for the Brain Development Laboratory run by Dr. Rick Gilmore at Penn State University. I have a background in biomedical engineering with a focus on imaging. In the last few years I have been assisting Dr. Gilmore with data collection, processing, analysis and publication of various behavioral and EEG based optic flow studies.
Reproducibility means that the processing of a dataset can be carried out multiple times by many users using the same workflow/code and get the same results. It also means that as more data is collected a few commands can be run to update the results based on the increased number of data sets.
Workflow
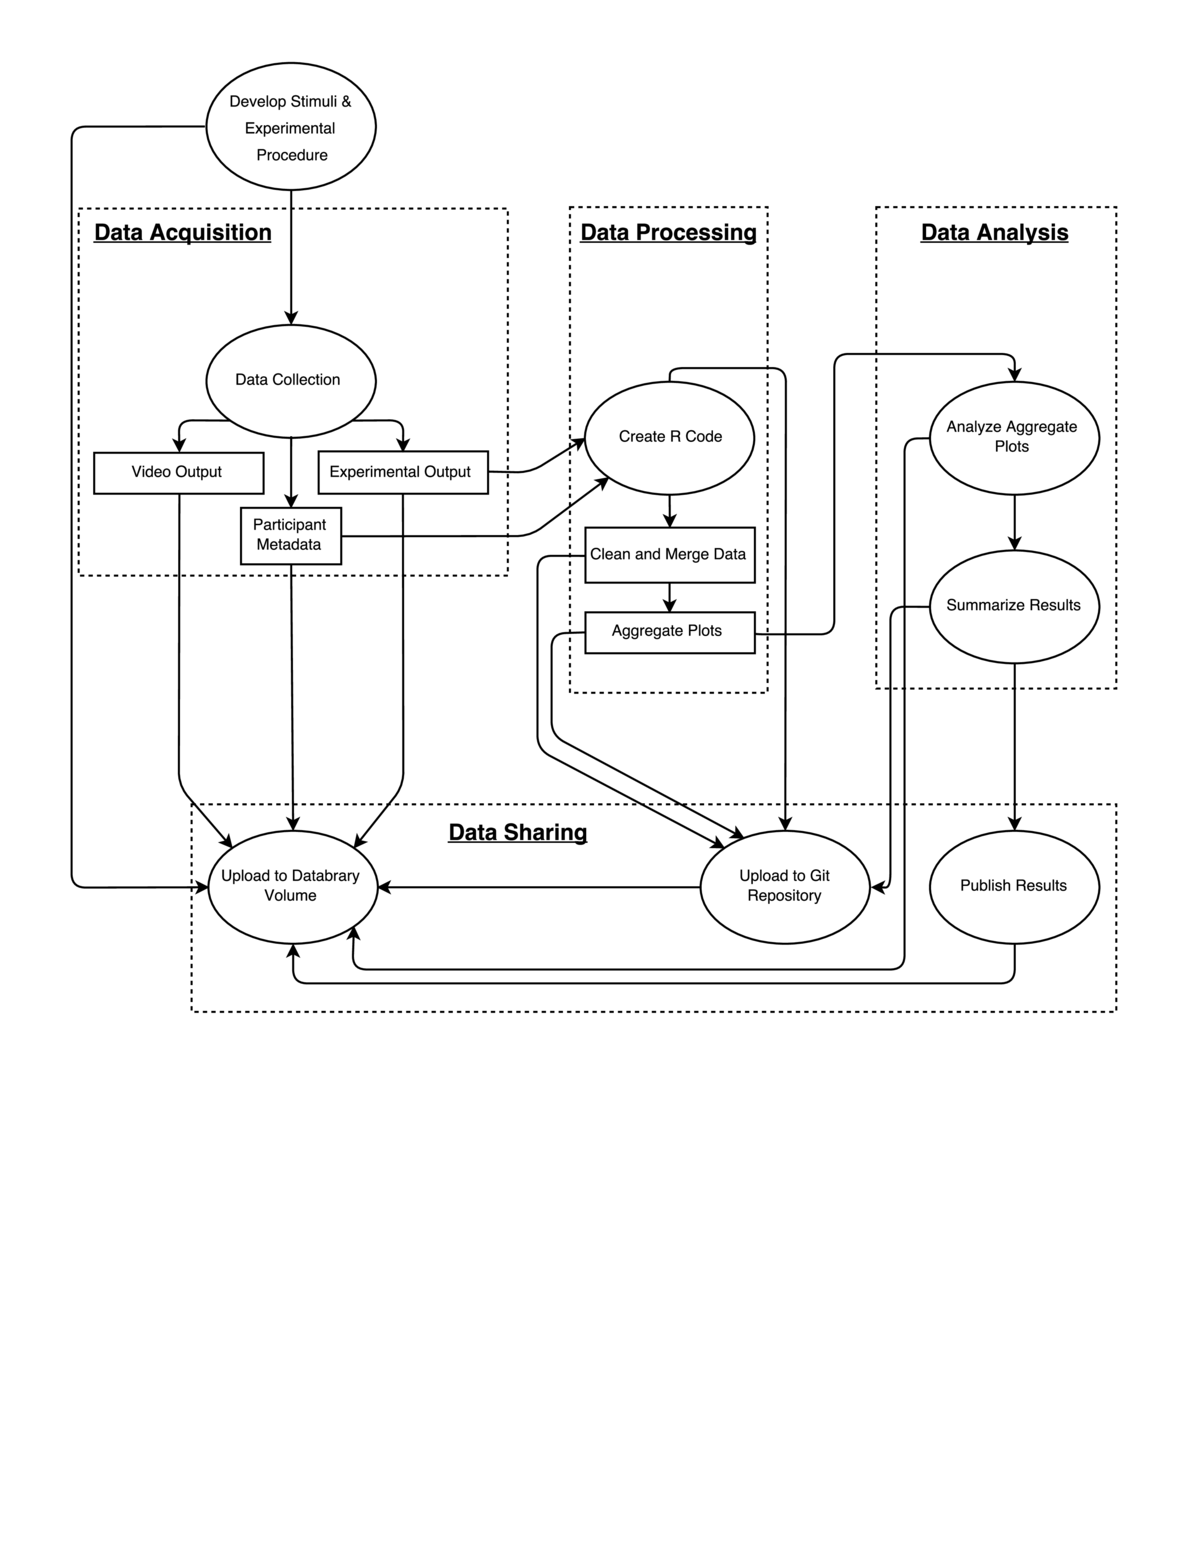 This study examined how sensitive child observers were to patterns of visual motion (optic flow) that differed in terms of their overall pattern and speed. The study extends one we had previously carried out with adults (http://doi.org/10.17910/B7V88T), and is part of a series of studies on this same theme (e.g., http://doi.org/10.17910/B7QG6W).
Data collection
Data were collected utilizing a script written in Matlab and the Psychophysics Toolbox to generate displays. Each display consisted of two side-by-side, time varying annular-shaped optic flow patterns consisting of small white dots moving against a black background. One side depicted random (0% coherent) motion while the other side depicted radial or translational motion. Within each trial, we varied the proportion of dots with coherent (non-random) motion. Some children saw patterns with 20, 40, 60, and 80% coherence while others saw patterns with 15, 30, 45, and 60% coherence. The participant's task was to determine which side of the screen contained coherent motion. The participant indicated their choice by pointing to the monitor. Across a set of four blocks, we also varied the speed of motion. Two blocks each were collected at 2 and 8 deg/s for a total of 4 runs.
Four separate output (CSV-format) files, one each from the 4 blocks, were generated for each participant by the Matlab script. Each CSV file included trial-by-trial information about the pattern type and coherence level of the stimulus, and reaction time and accuracy of the responses. Video was collected during participant data collection, as well. The file name consisted of the testing date (YYMMDD) concatenated with a four digit participant identifier (NNNN) the block order (1-4) and speed condition (2 or 8). This file naming scheme facilitated later processing.
During the recruitment phase, we have access to various forms of personally identifiable information (PII) about participants. This enables us to mail, email, and call participant families within our selected birthday range of participants. Most of the PII elements may not be shared with others and are stored only on local computers to which only our laboratory group has access.
Databrary
We use the Databrary digital library (http://databrary.org) to store and share data, including videos of the testing sessions. After a data collection session is complete, we create a session on Databrary's spreadsheet. We enter information about the participant (identifer code, sex, age at test, parent-reported race/ethnicity, test date, and birthdate) along with session-specific variables such as the condition, testing order, whether the session was for pilot testing or was excluded for some reason, and so forth. We upload each of the text-formatted data files and the video of the session (if available). We also ask the parent's and participant's permission to share the data with other researchers. We then record on the Databrary spreadsheet whether the parent and participant agreed to share data or not.
The combination of exact age, testing date, and date of birth are considered personally identifying under HIPAA. Databrary allows us to record all three data elements for our own record-keeping, but does not expose all three to other researchers unless participants have given permission to share data. If participants or parents decline to share data, only age at test and year of test is made visible. In some cases, we transfer data files to Penn State's Box cloud storage for analysis and removal of PII.
GitHub Repo
In addition to storing text-based data on Databrary, we store it in a GitHub repository for the project (https://github.com/gilmore-lab/moco-3-pattern-psychophysics/tree/master/child-laminar-radial). The GitHub repository is the home for our data cleaning and analysis code that is written in R by the lab director (Gilmore). The lab director conducts most of the analyses, and provides documentation about the analysis workflow in the comments of the relevant R functions or in the site's README file. Git's version tracking feature allows the history of changes to our analysis workflows to be carefully documented.
The data cleaning/file merging workflow consists of a series of steps. First, information about the participant ID number, speed condition, and block are extracted from the individual file names. These elements are added to an R data frame with the block-specific, trial-by-trial data. Then, the individual block data files can be merged or concatenated to create a session-level data frame for that participant. Using R's lapply, Reduce, and merge functions, it is possible to carry out these operations across a set of participant files to create a single data frame for subsequent analysis which is saved as a CSV file. The analyses/import-clean-export.R script illustrates how these steps are done. An example of the aggregate output data file created on 2016-09-15 from running this script is analyses/aggregate-data/moco-beh-child.csv. This file gets updated on GitHub periodically during the course of data collection. The second step is to analyze the data. We have not conducted formal analysis yet as we are still collecting data, but we have created some functions to visualize the patterns. The analyses/plot.aggregate.R function shows how we import the data file generated previously, summarize it, and create several illustrative plots (see analyses/img).
A similar workflow is utilized for multiple studies in this lab including EEG and other behavioral studies. The combination of Databrary, GitHub and R makes it easy to create a workflow for a particular type of data and reproduce it as more data are collected. This makes data sharing and analyses an ongoing process, and not something that is saved up until the end of a study. This makes writing abstracts and papers less cumbersome.
Pain points
The data transfer to Databrary can be time consuming. The output datafiles are stored locally in a folder for the CSV files and another folder for the .mp4 files. Uploading data (.mp4 and .csv) to Databrary has to happen manually as Databrary does not currently reorder files by file name. The .csv data also needs to be uploaded to Box/GitHub manually.
It's relatively easy to update the participant metadata file by exporting the data from Databrary as a .csv. From there the unnecessary columns for a particular analysis (e.g. Race, Ethnicity, Task name) can be dropped, leaving only the participant ID, test date, day age, and gender columns.
Key benefits
R contains many commands (e.g. merge, lapply, Reduce) which make it efficient to complete actions on multiple datasets at a time and to easily add datasets to the analyses as they are collected. We regularly 'borrow' a script used for one purpose and reuse it for a new study. By automating the data file manipulation steps, we reduce the likelihood of errors.
Key tools
Databrary allows for all of our data to be stored or referenced (e.g. GitHub, publications) in one place, and it encourages us to upload data as it is collected. This upload-as-you-go work flow is less cumbersome than post hoc data curation. Databrary volumes can be kept private to our research group until they are complete and we are ready to share the data with other researchers. Our practice is to share once we have presented our work in public or had a paper submitted for publication. Once a dataset is shared, the Databrary system creates a DOI for the dataset. This makes the dataset searchable by other researchers.
Questions
Why do you think that reproducibility in your domain is important?
Reproducibility is essential because if another researcher cannot reproduce our workflow and get the same results then the initial results may be incorrect.
How or where did you learn about reproducibility?
Self-teaching through online training and book learning.
What do you see as the major challenges to doing reproducible research in your domain, and do you have any suggestions?
Ensuring that everything on GitHub can be forked and rerun by another user. We have also begun collecting videos (with permission) of our entire experimental protocols. We think that all social and behavioral scientists should do the same in order to improve the accuracy of documentation about experimental procedures.
What do you view as the major incentives for doing reproducible research?
It upholds scientific ideals.
Are there any best practices that you'd recommend for researchers in your field?
Automate as much as possible. Document, document, document. Start today.
Would you recommend any specific resources for learning more about reproducibility?
R Coding and R Markdown training: https://www.rstudio.com/online-learning/