An Analysis of Household Location Choice in Major U.S. Metropolitan Areas Using R
Andy Krause and Hossein Estiri
I am Andy Krause, a Lecturer in Property (Real Estate) at the University of Melbourne. My research focuses on the spatial analysis of real estate markets, particularly in regards to valuation and location. This work was completed with my colleague, Hossein Estiri, Research Fellow at Harvard Medical School. Hossein uses data science approaches to study urban energy and health.
Workflow
 This research analyzes the household location choices of American households in the largest 50 metropolitan areas in the United States. Households are broken down by five-year age cohorts (based on the age of the head of the householder) and mapped against the household's distance (census block group level) from the central business district (CBD) of the metropolitan area in which they reside. In polycentric regions such as Seattle (Tacoma, Bellevue and Everett as alternative CBDs, analyses are conducted on distance to core center as well as secondary centers. An initial paper reporting the results is currently under review.
All data, code and analytical workflow are hosted on-line. Code and analytical workflow, including analytical script and custom function sets, are written in R and found on the project's GitHub Repository. The complete set of raw data is available through the U.S. Census. Users wishing to skip the data compiling and/or cleaning steps can download the compiled or cleaned data from the project's Dataverse Repository.
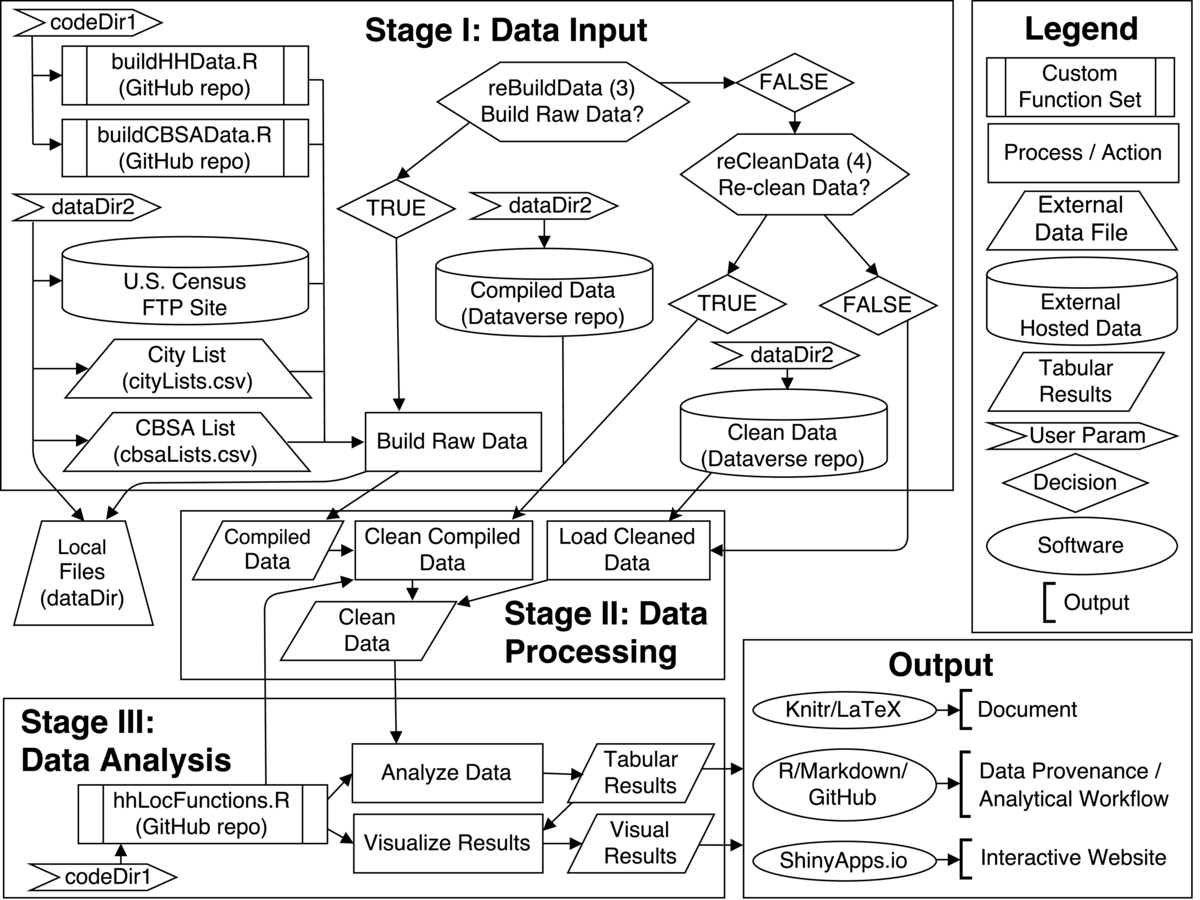
The hhLocAnalysis.R file is the main analysis script and the only file that needs to be executed. Two key path parameters and two key process parameters must be manually set at the beginning of the hhLocAnalysis.R script:
codeDir: Location of the cloned GitHub code repository
dataDir: Location of the compiled (and/or cleaned) data downloaded from Dataverse
reBuildData: Do you want to go through the entire data compilation process?
reCleanData: Do you want to re-clean data?
Additional parameters containing the file names of the downloaded intermediate data and the path to export the results may need to be set also be set prior to executing the script:
rawDataFile: (Optional). If reBuildData is equal to FALSE and reCleanData is equal to TRUE then you will need to provide the name of the compiled data file (within the dataDir) downloaded from Dataverse.
cleanDataFile: (Optional). If both reBuildData and reCleanData are FALSE then you will need to provide the name of the cleaned data file (within the dataDir) downloaded from Dataverse.
figurePath: (Optional) If you intended to output the plots enter directory to export to
This is the extent of manual operations. All other processes run automatically. If the data is fully built (reBuildData = TRUE and reCleanData = TRUE) this process may take multiple hours. Additionally, the user may change a number of the optional parameters that handle the distance scaling, overall number of metro-regions to analyze, maximum distance from central business district centroid to include in the data and whether or not computational progress is reported.
Stage 1: Data Collection
Based on the parameters selected above the data collection phase of the study either downloads the compiled (reBuildData=FALSE and reCleanData=TRUE) or cleaned data (reBuildData=FALSE and reCleanData=FALSE) from the Dataverse repository or compiles all of the raw data directly(reBuildData=TRUE). To compile the raw data, files for every county in the fifty largest metropolitan areas are downloaded, unzipped, cleaned and written out as a standardized .csv (comma-separated value) file. This raw data is hosted on the U.S. Census Bureau's FTP site. Custom functions to handle the data acquisition process were written in R and are found in the buildHHData.R and buildCBSAData.R files in the repository.
Stage 2: Data Processing
If the data is to be recleaned, then the data cleaning functions are employed at this step. In this process observations with missing data are removed and information on the core-based statistical areas (CBSAs) are added to the compiled data. If cleaned data is directly downloaded then this pre-cleaned data is passed forward to the analysis stage.
Stage 3: Data Analysis
The analytical process begins by calculating the location quotient distance profiles. Location quotient profiles measures the proportion of a given household type at a location versus the proportion of that household type in the entire metro region. Location quotients higher than 1 indicate that, relatively speaking, more of a given household exist at a given location then would be expected if households were randomly distributed. The hhLocFunctions.R file contains all of the custom functions necessary to calculate and visualize the location quotient results.
Data visualization of the results via a variety of different plotting functions follows. Final results, both tabular and visual, are then combined in an RStudio/Knitr file along with the narrative to create the final document (compiled in LaTeX). The full data provenance is described and hosted on the code repository via a Markdown file. Also note that the collaborative website Authorea (which offers git-based tracking and LaTeX support) was used by the authors to write the first draft of the narrative portion of the report.
Pain points
There are two major steps that we consider particularly painful. The first is convincing yourself (and co-authors) to take the time to properly document every action and to take the time to fully annotate the analytical workflow. This can be especially difficult when deadlines arise or when co-authors do not see the value in reproducibility. The second is the need to write custom functions that are generalizable. Writing very specific, single use functions can be easy, but are rarely useful in more than a single instance. Good reproducible research contains flexible functions than can accommodate changes or permutations thereby allowing subsequent users to expand or change your original analysis.
The current peer-review process also presents a considerable hurdle to reproducibility. In order to remain anonymous in the review process, we've had to build a set of anonymous code and data repositories and interactive websites for the review process and then switch over to our own repositories after the paper has been accepted. It means a lot of extra work as well as remembering which GitHub account we are signed into at all times. Along this line, judging by usage statistics, reviewers have been uninterested in actually examining the hosted code, data or results.
Key benefits
For us the biggest benefit is efficiency. The first time we do an analysis it usually takes longer than it would take other colleagues, but each time after the time savings multiply. One situation where this is particularly helpful is in responding to peer reviewer comments and requests. Changes to assumptions or sensitivity tests on parameters can be done in a matter of hours (or minutes), not days or weeks. This greatly shortens the re-submittal response time. Related, we constantly find ourselves borrowing old code and re-purposing it, making new analyses easier and faster.
(Andy) Better organization is another benefit. No more folders full of data files with version names and dates. No more mystery fields in a dataset. No more starting all over after forgetting what was previously done. My students and their Excel sheets with dozens of tabs and screen clips from SPSS (or other point and click-based statistical software) remind me of this benefit every semester. I am slowly incorporating more and more reproducibility into my classes, with the intent of breaking some of these bad habits that students have.
(Hossein) Another benefit would be built greater capacity for related research. Beyond the theoretical approach that can be used to study other metropolitan patterns, functions that we built in this research can be applied to facilitate other forms of research using census data. Researchers can adapt these functions to address other purposes. In an ideal scientific world where all research is reproducible, research will be more efficient because of the code that can be shared, re-used, or adapted for research or non-research purposes.
Key tools
The RStudio integrated development environment (IDE) and their related Shiny Apps (interactive web applications) have been a huge help in our reproducible research. If you are an R programmer and want to share your visualizations with non-programmers, we highly recommend these tools from RStudio. Using the IDE allows for easier navigation between multiple scripts, reviewing a history of plots and offering a view of all objects in the current computing environment.
Questions
What does "reproducibility" mean to you?
"Reproducibility" means that a subsequent interested party can openly access the data, code, analytical workflow and data provenance to re-create the research (and ideally produce identical results) WITHOUT consulting the original researcher(s). In this context, "reproducibility" can facilitate the verification of results from a given research project and also accelerate new research discoveries by providing reproducible modules that can be applied in other settings and/or for other purposes.
Why do you think that reproducibility in your domain is important?
(Andy) A majority of quantitative analyses in real estate (both academic and professional) is usually duplicated by numerous parties, widely disseminated and frequently updated; all characteristics that benefit from reproducible analyses. Despite these core facts of the discipline, there is very little, if any, discussion on or attempt to create reproducible research in the field.
(Hossein) In general, the importance of reproducibility in policy-/decision-oriented fields is not clear. It can certainly improve policy research, but one could debate whether or not reproducibility has direct benefits for decision-making.
How or where did you learn about reproducibility?
(Andy) My pre-academic background was as part of a team of expert witnesses in litigation support. In this industry, any analysis that was produced had to be reproducible by the opposition and therefore, my firm was constantly striving to produce more efficiency in their reproducible analyses.
What do you see as the major challenges to doing reproducible research in your domain, and do you have any suggestions?
(Andy) Two challenges exists in the real estate field. First, most data is proprietary and expensive and therefore it is hard to share data. Second, it is a small field that is composed of many senior individuals (both in academia and industry), many of whom are very resistant to change.
(Hossein) In health sciences the biggest concern is around data privacy. For example, research on individual-level patient information can hardly become fully reproducible, within conventional workflows.
What do you view as the major incentives for doing reproducible research?
Doing reproducible research is like installing solar panels in your home. It will cost you at the beginning, but down the road you will get benefits such as time savings, better quality output and the increased opportunity to collaborate/share ideas.
Are there any best practices that you'd recommend for researchers in your field?
No more manual data cleaning. Use code.
Would you recommend any specific resources for learning more about reproducibility?
For collaboration, if you want to get away from writing in LaTeX, you can try Authorea. If you are in Australia, the University of Melbourne's Research Platforms group offers a number of Research Bazaars, Software Carpentry and Reproducibility-related courses and event. It is open to researchers world-wide.