All or Nothing! Public Goods Provision under Partial versus Full Decentralization in Indonesia
Deepak Singhania
This chapter appears only in the online appendix of the book The Practice of Reproducible Research. Please cite this online version of the book as: Kitzes, J., Turek, D., & Deniz, F. (Eds.). (2018). The Practice of Reproducible Research: Case Studies and Lessons from the Data-Intensive Sciences [Online Version]. Retrieved from http://practicereproducibleresearch.org.
I am Deepak Singhania and my area of research is in development economics and applied microeconomics. My main research also has some elements of political economics. I am a fifth year doctoral student at the University of California, Riverside. My research explores the welfare effects of complementarities between different types of decentralization. The existing literature is unclear about the direction of the effects of decentralization of governance on the provision of public goods. In my research, I argue that one of the main reasons for this ambiguity could be the misidentification of decentralization type. Theoretical literature broadly classifies decentralization types into administrative, political and fiscal decentralization. Different decentralization types and their complementarities can have strong implications for the identification of decentralization effects, and ignoring such complementarities could result in omitted variable bias. I address the identification problem by analyzing the complementarities between administrative and political decentralization under universal fiscal decentralization across Indonesian districts between 2000 and 2008. My results show that public good provision increased in the districts that faced both administrative and political decentralization compared to the districts that faced only one type of decentralization or no decentralization.
Research by definition means repeated systematic investigation which means testing and re-testing the existing findings. I see reproducibility as a way to justify the very meaning of the term research. Reproducibility is essential in my research on decentralization because I am challenging the existing findings and methods in the decentralization literature. I would like my idea of comparing different decentralization types to become a standard way of conducting a decentralization study and for this I need to ensure that my work is reproducible. I plan to make it reproducible not just within the Indonesian setting but even for using my method to test the findings in other settings.
Workflow
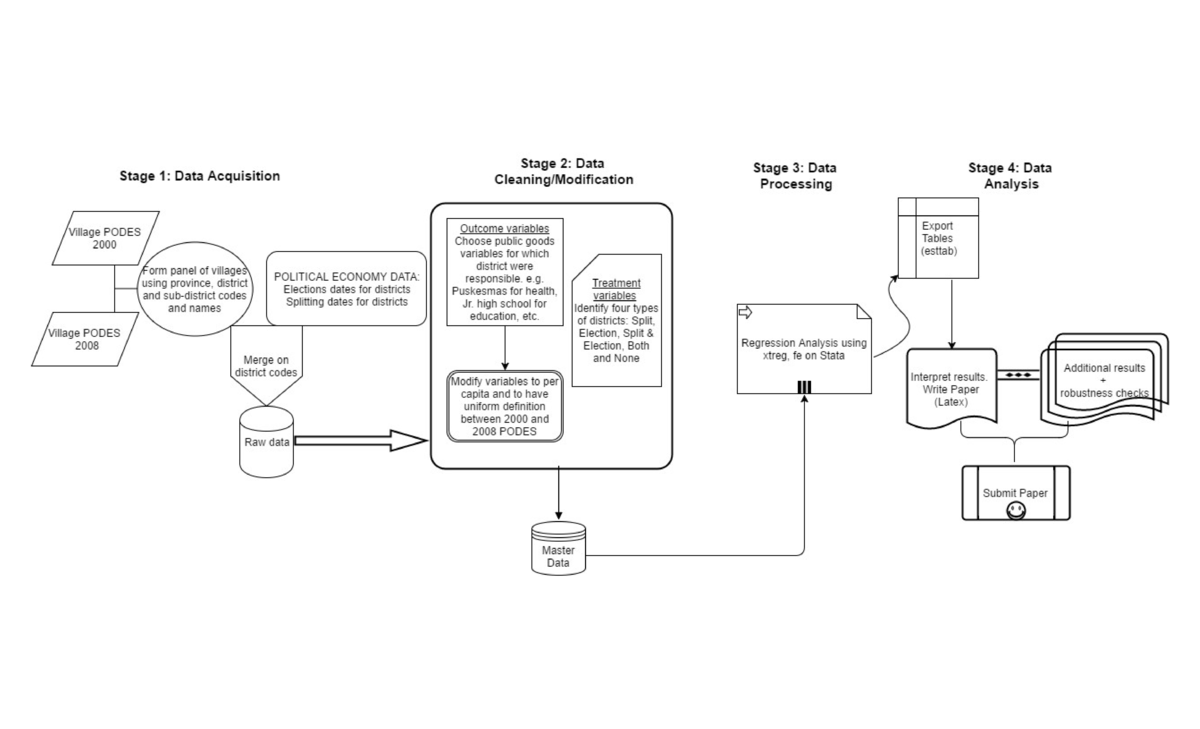 I have used two main types of data. The first is public good related data which is available from the Indonesian statistical agency (BPS). This data is a census of Indonesian villages and it is called PODES. I have used the 2000 and 2008 waves of PODES for short period analysis and the 2011 wave for a medium period analysis. This data is not public but it can be purchased easily from the BPS website. For reproducing my main results one can use just 2000 and 2008 waves. The second type of data is political economy related information for Indonesian districts. There are two sources for this. Data on date of district splitting is freely available from BPS, one can email them. I obtained the dates for the election of district heads from Burgess et al. 2014. These dates are also available from Home Ministry of Indonesia, although I had a difficult time arranging the dates from there.
PODES is a huge dataset with over 200 variables for 60,000+ villages. One needs to be careful while using the same variable over two or three waves because the variable names and definition keeps changing. I picked those public good related variables for which districts governments were directly responsible. I got this information from some of the existing papers. Once the right set of variables are gathered and the definition is made uniform, this data is ready to be used for outcome variables. This data has various other variables that could be used as explanatory variables but I haven't used them in my paper because it is difficult to add explanatory variables other than the main treatments due to endogeneity issues between other explanatory variables and treatment variables. However, this would not change the main results of my paper.
Political economy data has district codes and names which can be used to merge them with PODES. For the treatment 'split', I assigned a dummy to the original part and the new part of the districts that were split. Similarly, the treatment of election was assigned using the dates in the data on elections. Now, the merged political economy data and PODES datasets are ready for the main analysis. In order to apply a differences-in-differences with fixed effects estimation strategy, I used the xtreg command in Stata [version 14 SE] to produce my main analysis results. The fixed effects were at the level of villages for which I needed a panel of villages. I discuss this panel as a pain point for reproducibility in the next section. I exported the results from Stata to .eps format so that I could produce LaTeX version of the tables. Since there were many variables under different categories, it took some iteration to produce tables that could be easy to explain.
I have commented my code extensively. I plan to make it available for each of the datasets that I have used. The process is long but straightforward. One favorable thing in the case of Indonesia, which is not true in many developing countries, is that the codes and names for districts and provinces are pretty much similar across various datasets and so it is not very difficult to match them. I would say that my codes are very carefully written and not difficult to comprehend. So it should be easy to replicate my work with my codes. Also, my specification is straightforward which will make it easier to do a similar analysis in other contexts.
Pain points
One of the main challenges in empirical research in developing countries is to work with huge datasets, at times messy ones. It was particularly difficult in the case of Indonesia because some of the data was in Bahasa language. I used Google translation to understand the variables and their meaning in PODES dataset. With a little practice it became easy to do this.
Another big problem was to convert the PODES datasets into a panel of villages. For this I used the codes and names for provinces, districts and sub-districts to match the villages. With a two weeks' time I could successfully create a panel of 94% of the villages in the baseline. I am willing to share my codes for this so that the replication of my work becomes feasible. Since it is a census of villages and I have used all the villages, with the exception of three regions for which reasons are mentioned in my paper, it should be possible to perfectly replicate my results.
Another small problem one could face is in matching codes for districts between different waves of PODES with political economy data. I used the Indonesian proliferation crosswalk available at the World Bank website under INDO-DAPOER page. They have provided district codes for every year since early 1990s to recent years. I would recommend researchers double-check the matched district codes and names (there are 434 districts in the endline) across datasets which should be a quick job using the command exact() in Excel.
I would say one should be very careful in writing codes. Just because a big dataset is available, one must not retain all the variables in the master data. Be stingy in choosing the initial variables and then keep adding more. A large part of mistakes happen due to unnecessary variables and unnecessary codes for them. Another specific piece of advice is that while re-working on an already written set of codes which you think won't need or you have a better way of doing it, never overwrite the original set of codes because you never know if the new ones are going to be fine. Copy the original ones first, paste them on a new command window and then work from there.
My next suggestion is about transferring results from Stata. Never copy and paste results. Easier tools like esttab and outreg are available to make our lives easier. There is an initial fixed cost of learning these tools but it saves a lot of time and error in a long run.
I haven't used version control yet since I got introduced to it recently. It's very useful and I intend to use it more often. I believe that I am good at archiving my old files and working the new ones in a separate folder, but we can't really trust human error. When tools like github and the Open Science Framework are available, why take risk?
Questions
Why do you think that reproducibility in your domain is important?
Many important public policy decisions are based on the results from research in my field. Most of our work involves testing the effects of something on economic welfare. If these results are wrong, due to whatever reasons, then it might affect valuable resources targeted towards improving lives. So, it is important that studies are made more and more reproducible in my field. After all the main objective of doing research is to have a positive impact on society and for such big objectives research studies must be subject to scrutiny. It is not an individual thing but it involves society-wide values.
How or where did you learn about reproducibility?
I learnt some of it from one of my committee members Professor Joseph Cummins while we were working on a collaborated paper in his class. But most of it I learnt recently at a Berkeley Initiative for Transparency in the Social Sciences (BITSS) workshop.
What do you see as the major challenges to doing reproducible research in your domain, and do you have any suggestions?
I believe the biggest pitfall in doing reproducible research in my field is that journals don't have strict requirements for publishing codes along with manuscripts and also for releasing data, if possible. If these requirements are met then even when the data are not accessible, at least the codes can be cross-checked and used in a different setting where similar data would be available. The fear of being public, with all the work, would require researchers to be more careful in with their analysis. The best way to create such environment lies at the behest of journals.
What do you view as the major incentives for doing reproducible research?
The incentives I can think of are as follows. Availability of funds for doing reproducible research would play the most important role. Another method could be to create opportunities for making a career out of doing reproducible research by appointing positions or special cells within university departments to conduct reproducible research. Lastly, it will be best to instill the values attached to reproducible research at an early stage and this could be done by including a chapter on this topic in the undergraduate course curriculum.
Are there any best practices that you'd recommend for researchers in your field?
While writing codes, always write them with the thought that you would have to publish it along with your manuscript. This way you would make sure that it's simple to understand, you have enough comments and you name your variables in sensible way.
Would you recommend any specific resources for learning more about reproducibility?
I would recommend http://www.bitss.org. If one can master all that is available here, it should be more than enough.