Reproducible Workflows For Understanding Large Scale Ecological Effects Of Climate Change
Karthik Ram
My name is Karthik Ram and I am a quantitative food web ecologist by training. I received my PhD in 2009 from the University of California, Davis. Since then I've studied the impacts of climate change on the rate at which the landscape greens up in spring time, and the consequent effects on a large mammal food web, among various other projects. The Yellowstone project was my entry into data science, where I was thrust into the challenges of validating (reproducing) someone else's work before continuing on with my own research. During this time I also encountered various pain points, which led me to create my own version control system before I learned of the existence of git. In my current job I've transitioned from a full-time research scientist to a hybrid role, where I spent part of my time on research activities but the rest on developing tools and workflows to support various stages of a reproducible research workflow which I describe below.
Workflow
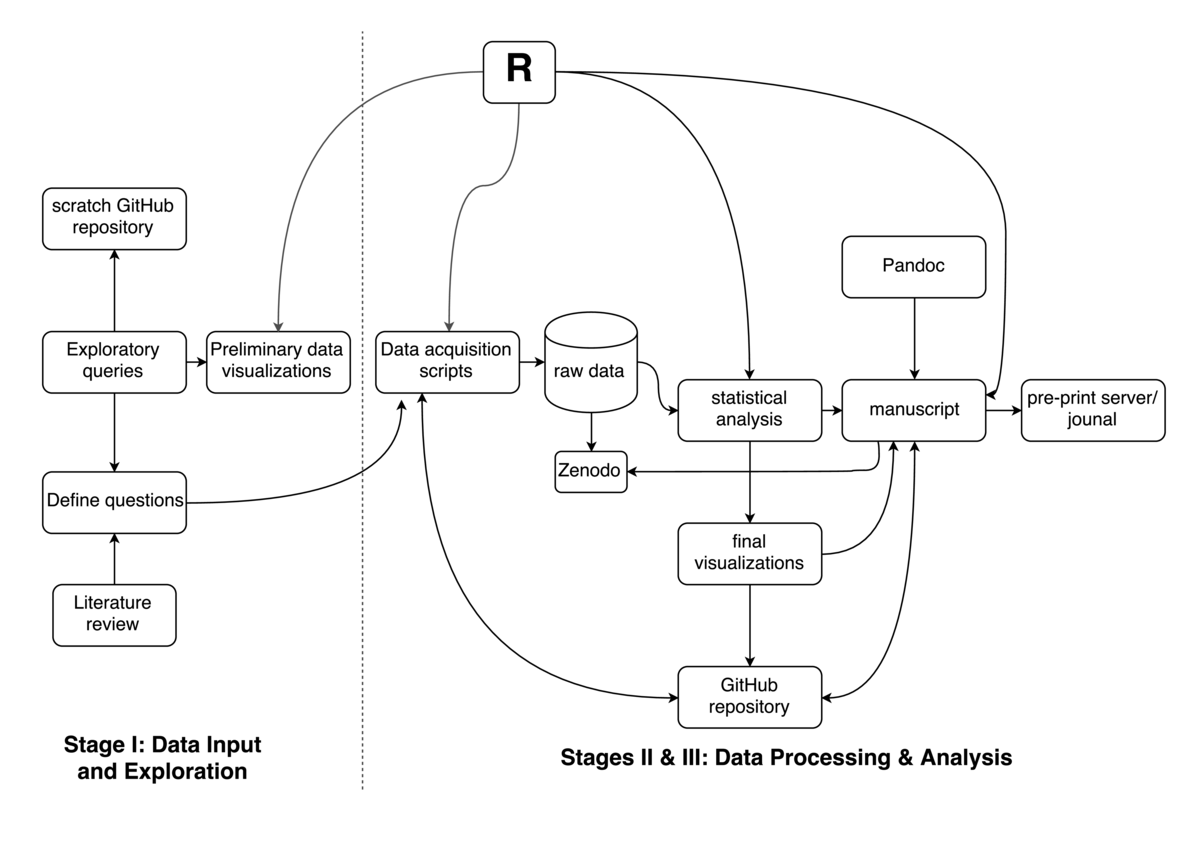 Even though this narrative does not describe any specific project that I work on, it captures the general workflow I employ for all my projects. With all of my messy, raw data ready, I spend considerable time on exploratory data analysis during which I generate several visualizations. This process allows me get a sense for any early quality issues with the data and the kinds of steps I will need to employ to make the data usable for analysis. All of the code I use for this process (usually
 R), along with the outputs (rendered markdown and figures using packages such as ggplot2 and knitr/rmarkdown) are committed to a scratch GitHub repository. This allows me to share early insights into my data with my collaborators. This process is highly iterative, and I generate various visualizations (across multiple branches) to gain a better insight into my data. This process takes me a few weeks as I multi task other projects. During this time, project collaborators and various others, including my Twitter followers, provide constructive feedback.
During this process I also document any data cleaning steps I'll need to undertake before I begin any data analysis steps. At this time I also deposit my raw, unprocessed data into a persistent repository such as figshare, or a Zenodo collection, and obtain a permanent identifier. figshare is a private company that provides free data archiving to individual users. Zenodo is an EU funded research archive that allows scientists to deposit various types of digital objects, including software and code.
I simultaneously start writing code to clean my data using a scripted workflow which also involves mostly R. I sometimes use a bash script or two to pre-process the data using old unix tools like sed and awk but with recent developments in the R toolkit (data.table, dplyr, tidyr, and rvest) I rely less and less on my bash scripts. These scripts are called inside a Make file, which allows me to generate my cleaned datasets at any time with a simple command line call e.g. make clean_data. At this time I also start the process of creating a separate library for the project to capture the right versions of my tool dependencies, such that further updates to my computer don't affect the reproducibility of my work. In the case of R, I use a library called packrat to accomplish this. Once my data are cleaned, I deposit them back at the same identifier on the persistent data repository and include the DOI in the text of my paper.
The data analysis and modeling steps vary based on a project to project basis as some involve simulations on a cluster. For smaller projects, a handful of scripts accomplish this process. If any of my code is reusable in more than one step, I capture these into common functions, and sometimes convert this into a separate package. This allows me to further modularize my code. For projects that involve simulations on clusters, I create scripts that work on smaller examples for local testing, with full version that run on high performance clusters (HPC) and write out my results to disk.
Somewhere along the way, I also begin a Rmarkdown file, i.e. my manuscript, which is merely a markdown file with embedded R code captured inside code fences with some metadata. In addition to including small snippets of code, I am also able to source in larger chunks of code from my scripts without cluttering my document. The manuscript is also rendered from my Makefile frequently. I also include additional code to turn the Rmarkdown → markdown → PDF (using Pandoc), which gives me a sense for the how the final manuscript might look line. All of the code, figures, and raw/rendered markdown files are committed to my manuscript's GitHub repository. I have configured git to ignore large intermediate files that could easily be generated again in the future. As a researcher who practices open science, I leave the manuscript publicly accessible in my (or collaborators') GitHub repositories. GitHub now renders both the PDF, and also both the unparsed markdown (RMarkdown) and the markdown files on the browser, allowing anyone to review my work in progress.
For citations, I use the knitcitations R package to embed DOIs into my text, which are automatically rendered into full parsed citations and a bibliography during the Make process. For projects that cite content such as blog posts, I rely on Mendeley's bibliography rather than retrieving citations from Crossref using knitcitations.
Pain points
The two biggest pain points in my research are related to black box data and unscripted data processing steps. I frequently collaborate with researchers who process one or more chunks of data using proprietary, closed sourced software. Quite often, these steps are also not scripted, requiring human intervention to update outputs as input data change. This combination of factors results in out of data versions of one or more pieces of input data simply because there was no automated way to determine what steps needed to be rerun.
In an ideal world, all my data would be a few simple queries away, allowing me to write concise scripts to retrieve the raw data before analysis. In reality, my data are a hodgepodge of manually entered data, sensor derived data (often bulk downloads after a mandatory sign in step), and other data retrieved via application programming interfaces (API). I try to alleviate the burden for anyone trying to reproduce my results by depositing all of my raw data and associated scripts into either institutional or other repositories so that others can replicate my research.
Key benefits
The key benefits to the approach I have outlined above are that anyone with the right technical skills can clone all of my code from a repository and re-run all the steps necessary to acquire the raw unprocessed data, munge the data, then run all associated statistical analysis and generate the full manuscript as published in a pre-print server or journal. Depending on the complexity of a paper, this could either be a single step, or a series of steps linked together in a Makefile. My work almost always include instructions in a README file.
Key tools
I've outlined my major tools inline but briefly: Programming tools: R, Make, git, Pandoc Services: GitHub, Zenodo, figshare, Mendeley
Questions
What does "reproducibility" mean to you?
In the broadest sense, reproducibility means that I would be able to read a paper in my area of expertise and be able to run another version of the study (and experiments described within) by following the methods and protocols described within that paper. In my specific context, clear instructions would allow me to implement an experimental design/setup using identical organisms and chemical reagents. After the experiment is completed and the data are entered, I would then be able to analyze my data using models and parameters, possibly even reusing code where such methods where implemented. This would allow me to obtain results and compare them to the original.