Analyzing Cosponsorship Data to Detect Networking Patterns in Peruvian Legislators
José Manuel Magallanes
My name is José Manuel Magallanes, I am a Senior Data Science Fellow at the eScience Institute of the University of Washington, where I am also a Visiting Professor at the Evans School of Public Policy and Governance (2015 - 2017). Since 2003, I have been Professor of Political Science and Public Policy Methodology at the Catholic University of Peru. My research is related to framing political and policy problems with a computational social science approach. I have dealt with different topics including electoral behavior, public management performance, climate change and social conflict, and legislators behavior. My contribution for this case will be a research carried out on bill cosponsorship data to detect key players, reveal association patterns, anticipate party splitting and detect tactics to get re-elected.
I have a BSc in Computer Science (UNMSM - Peru), a MA in Political Science and Public Management (PUCP - Peru), a Phd in Psychology (UNMSM - Peru) and a Phd in Computational Social Science (George Mason University-USA).
Workflow
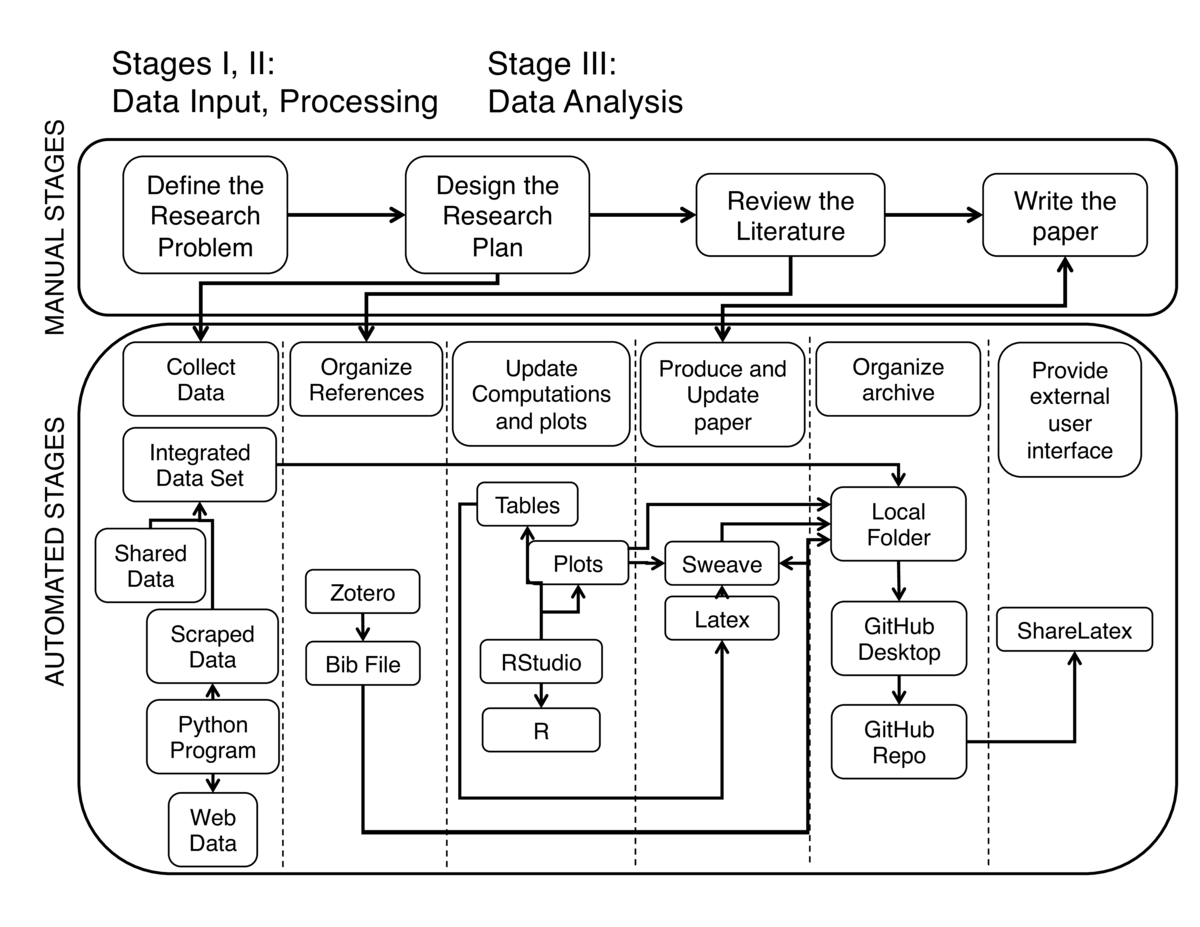 The workflow above represents:
a. Manual Stages:
1.  Define the Research Problem.

2.  Design the Research Plan.

3.  Review the Literature.

4.  Paper writing.
b. Automated Stages:
1.  Collect Data.

2.  Organize References.

3.  Update computations and plots.

4.  Produce and update Paper.

5.  Organize archive.

6.  Provide external user interface.
A. Manual Stages
a1. Defining the research problem. There has been an interest in the political science community in Peru to learn more on the dynamics of their National Congress. Particularly, Peruvian scholars and pundits have been discussing some particular phenomena affecting the congress dynamics:
The low re-election rate of legislators the previous two elections (~20%).
The fact that some legislators migrated to other parties during their mandate (party switching).
The fact that parties that had a good share of seats, ended up splitting their seats (It is worth keeping in mind that Peru has a multiparty system).
Some scholars in the USA have using bill cosponsorship data as a proxy to understand some of these issues, so I decided to follow a similar approach. However, the complexity of the Peruvian case was higher than the bipartisan American Congress, but the data was less available in the Peruvian case; as this work used one Congress data while there are only five Congress periods available on-line as webpages (no API and no data to download).
This stage was done only once. I was the only one in charge to define the research questions (no co-authors); however, some colleagues participated in informal exchanges of ideas. No particular computational tool was used in this stage.
a2. Designing the Research plan. This stage identified the main authors that have worked similar research problems before. The key ingredient in all cases was bill cosponsorship. However, most hypotheses were not the same I had, due to the different political regimes that researchers were focusing on. But, in all cases, bill cosponsorship was considered a good proxy to understand legislator's associative patterns. From this stage it was clear that:
We would need to write code to extract the information from the Congress of Peru website, as the data was not available for download by any means. This process, also known as web scraping, collects poorly structured data from webpages, and gives them a structure that could be used in further computational or statistical analysis.
To test the hypothesis, the information of a complete Congress would be needed (five years).
The information from the bills would need to be complemented with the archives of the National Jury of Elections. There, personal information on every legislator is available. This information was downloaded.
There would be a need for graph or social network techniques.
The budget available would require the use of free tools.
There would be a need to share the findings with other scholars.
This research could be combined with other efforts in another similar countries. There was a need to organize efficiently the process, so that the data and the code could be reused.
This stage was done only once. I was the only one in charge to define the research plan. No particular computational tool was used in this stage.
a3. Review of the literature. This step allowed me to identify similar cases and organize my basic set of references. The references were continuously updated along the process. I was in charge of updating, but also got some recommendations from the users I shared my drafts with.
a4. Write the paper. As expected, this was a manual step. However, as I describe later, this was supported by different tools. As usual, this step was repeated many times. I was the only contributor.
B. Automated Stages
b1. Collect Data. Data was collected from two main sources:
The Congress webpage. This website has a webpage for every bill proposed. The webpage has detailed metadata on each bill, including the authors (legislators), which represent the nodes of the network.
The INFOGOB webpage. This webpage provided the information needed to organize some attributes of the legislators (nodes).
The INFOGOB webpage is organized in such a way that you can download information for different processes. It also helped me get the political history of every legislator.
The webpage of the Congress was much different. The information needed is visible as webpages, but they do not offer a download service or a mechanism to get the data (known as API - Application Program Interface) in a structured way. For this reason, a code for scraping the website was needed. The code was written in Python, relying mainly on the beautiful soup package. I created some extra code to 'clean' the values collected.
So, with INFOGOB, I built the attributes of the legislators; and, with the scraped data, I built the network. Both data sets were merged using Python's Networkx. The merged file was saved as a GraphMl file and also as a two separate file of edges and nodes, which will ease exporting into R.
This process was done entirely by me. It was the first part of the operational research and took around two weeks. The Python version I used was 2.7, and it was installed via Anaconda. I used the Spyder graphical user interface (GUI) to do the coding.
b2. Organize references. References are a key component of academic writing. In my case, besides papers and books, there was also the need to include webpages, white papers, code, data, and so on. As it is common, there are set of references you know you would use when you start writing, but more come along the process as you exchange ideas with colleagues. In this particular aspect, the use of Zotero was very important. It allowed to create a BibTex file to be used later during the paper production process. This text will later be integrated into the LatTex document of this work. Automating this process not only helps you recover the right of citing a work, but also gives you the flexibility to later change the style (APA, Chicago, etc - see citation list) a particular publisher will require. This was extremely important as this research could be presented in social sciences or computer-science-related conferences.
This process was done entirely by me. This was a continuous process as the paper was written. The desktop version of Zotero was used. The BibTex was saved in the working folder.
b3. Update computations and plots. While data collection and structured datasets were produced in Python, the exploration of the data, the test of hypotheses, and the visualization of results was done in R. I decided to use R for a simple reason: RStudio can combine LaTeX and R in an easier way than Python via its sweave library. Sweave differentiates between text and R code; codes are organized in chunks that also can interact with the LaTeX code.
This eased the update of the tables and plots produced by the data, as sweave documents will rerun the R code and update whatever is needed. This was a crucial part to make this work more reproducible; and also for me, as I could try different layouts for the network plot and pay closer attention to final appearance of the paper.
This process was done entirely by me. This was a repetitive process as the paper was written. A Rnw file was produced using RStudio, which also produced a LaTeX file.
b4. Produce and update Paper. RStudio integrated my writing, the bibliography file, and the tables and plots generated using R into a LaTeX document, which finally would produce a pdf document (RStudio, via knitr, instead of sweave, can produce also an html document) . Any change in whatever part of the main document or any of the files used was updated in the final product automatically.
It is very important to keep in mind that sweave allows LaTeX users to customize all the details in the document, which includes code highlighting or hiding, among other possibilities. I could even present the Python code inside the document as needed.
This process was done entirely by me. This was a continuous process as the paper was written. And in fact, there were many versions that I could share with colleagues. LaTeX complied the R chunks producing tables and plots, and compiled the bibliography into the main document from the BibTex file generated in Zotero.
b5. Organize archive. One of the first steps after the research questions were clear, and before any coding was made, was the creation of a GitHub private repository. This repository was cloned into my laptop, and all the files were organized in this folder, including code, data files, bibliography files and plots. In a way, using a repository that will be online forces you to organize your work and folders since the beginning. Before becoming a GitHub user, preparing the final version of my work took too much time; a good planing when using GitHub will force you to your system of folders ready when you are done with the paper. An additional advantage is the version control power you have when using GutHub, which I had to use just one time, to recover a version that had a code that produced a better plot than one I thought was going to work better. Without it, you need to be commenting and uncommenting code sections which increases, unnecessarily, the coding space.
This process was done entirely by me. This was a continuous process as the paper was written. The GitHub client was used for committing and synchronizing the local repository into GitHub.
b6. Provide external user interface. It was clear during the planing stages that I will need to share my drafts with other colleagues in order to get some feedback and/or discuss further collaboration on this matter. As the paper reflected an step-by-step approach, it would be easier for my colleagues to read the draft paper which included the code chunks, the plot and the tables. For that, I decided to use ShareLaTeX, which can collect the files in the GitHub repository and compile the LaTeX document. So, after I updated the GitHub with my last version, I could also ask ShareLaTeX to update its contents based on the latest document version I had recently pushed into GitHub.
This process was done entirely by me. However, the drafts were shared when most of the processing was finished. This was a continuous process as the paper was written. The selected users created ShareLaTeX accounts to see the LaTeX generated pdf version of my document. I allowed them to write comments in the LaTeX document using ShareLaTeX itself.
C. On the Data, Software and Processing
Data: The raw data as well as the cleaned and aggregated data are online, in a private GitHub repo. The data can be share upon request and instructions are included on how to cite it. The data files have a table-like structure to be easily read into R, but other versions were produced in xml-like format as I thought I may need to use other network visualization programs like Gephi.
Software: The Python code is also in the repository. The R code is embedded in the LaTeX code, and the paper itself describes the algorithms adopted in the paper. Most R chunks make constant use of the data scraped using Python. For GitHub, ShareLaTeX and Zotero, you only need to create and account and download the desktop version.
Processing: The processing of the data is reflected in the Python code flow, and it is online. The Python and R codes are commented extensively. It would be fairly easy for an external researcher to follow the logic of the research and replicate the results, or simply change the data from other country and get all the tables and plots in the final PDF, as R, Python and LaTeX are connected.
Pain points
This work was not producing a blog or a notebook, but a paper. So the most challenging parts were:
Produce a quality layout where tables and plots are located in the right place is hard. LaTeX is not exactly what you see is what you get, so you need to learn how to override some default behavior in LaTeX for that.
You can become too excited as you learn to use LaTeX, so you start thinking all the time to make it better, and it takes too much extra time because you need to include more LaTeX functions and need to learn how to configure them. It is better to do that after the paper is done.
Scraping several webpages takes time, and you learn that your code may only be usable for those particular websites. I scraped many pages, but all came from the same institution, so a project that involves scraping from more than one institution will deal with much more complexity.
A particular pain point is the lack of a reproducibility culture in the field I work. Political scientists in my country are not used to reproducible research. In fact, for every key paper that dealt with the kind of data I used, no further instructions were found from the authors or in the authors' webpages. In most cases, it is only mentioned what data was used but no links or other related procedures were clear.
Key benefits
I consider the way I worked allowed me to obtain several benefits:
Planing your research in a reproducible way is a great advantage to the scientific community you belong to. But most of all, it forces you to plan your work better.
Including version control forces you to have well organized set of folders in your machine.
Following a reproducibility approach will allow you escalate your work if more data becomes available or if a colleague wants to make a comparative work. I am sure this is not impossible without this approach, but I am sure that researchers can become much more productive than in the past.
Another important benefit is that allowing colleagues to audit your work gives you enough input to make a newer and more robust version of your work.
You have the possibility to produce plots with different levels of quality. R allows you to produce simple quality plots and more complex formats. In this case, I was requested a higher resolution of a plot in vectorized format, and I simply recreate the one I had, changing a couple of parameters.
Key tools
LaTeX was a key component in all this research and its reproducibility level. It offers a way to organize the paper and interact with code and data files, including references and plots. This can not be done using Word, as far as I know. LaTeX is not a common software in social scientists in my country. RStudio is also a key ingredient. Its capacity to transform the R chunks and its output (including tables, values and plots) into LaTeX makes the flow and update of research even better. Both LaTeX and RStudio facilitate reproducibility. Without R, the barrier for producing papers is even higher, but it can be done. It gives you more confidence and save you lots of time to update/edit your manuscript, compare to copy, past or inserting procedures in MsWord. The flow is simply great.
Questions
What does "reproducibility" mean to you?
In general, I consider this term means the level of reconstruction of a research that can be achieved by a person foreign to the researcher / research team via the code and data available in some repository. For me, reproducibility is not only that the foreign person can decompress and run and executable file to see the results, but be able to audit the whole process. The less feedback required by the auditor, the more reproducible a work is.
Why do you think that reproducibility in your domain is important?
Because computational social science is still young in many other countries. As in my case, data is just starting to become available, so following, and teaching, the reproducibility approach will benefit the research quality. In public policy, particularly, it will enable stakeholders participation in knowledge creation.
How or where did you learn about reproducibility?
I had no chance to have mentor or courses on this. I just felt the need to organize my work as many tools and data were available for my case. I was afraid that if I did not follow this approach I could easily get lost. Reproducibility demands good research planing, and it pays off.
What do you see as the major challenges to doing reproducible research in your domain, and do you have any suggestions?
If the data you are using is public, I see less problem. When the data is not, and you get access with a special permission, legal issues are always present. As for investment, my particular collection of tools are free, so it should not be a problem, unless your funding institution forces you to use particular tools. I also believe that this approach can be very challenging for older generations not used to this. I see less of a problem in younger generations of researchers.
What do you view as the major incentives for doing reproducible research?
The main incentives for me are project organization and ,m.l/. That is, reproducibility requires order, some structure to your work; then, you need to find a way to organize writing, code, files, and so on. I believe that LATEX enables reproducibility too, as it can interact seamlessly with other software elements, as shown in my work here. Auditability is important as it increases your credibility in the research community, mainly because anybody can follow closely what and how you did your work.