Analyzing Bat Distributions in a Human-Dominated Landscape with Autonomous Acoustic Detectors and Machine Learning Models
Justin Kitzes
My name is Justin Kitzes, and I am a quantitative ecologist who studies the effects of land use and climate change on biodiversity distributions. I am currently an Assistant Professor of Biology at the University of Pittsburgh, and I was formerly a Data Science Fellow in the Institute for Data Science at the University of California, Berkeley. The research that I describe below focuses on the spatial ecology of bats in a complex, human-altered landscape. This case study decribes the use of acoustic detectors, machine learning methods, and likelihood statistics to examine the effects of three large Northern California highways on bat activity.
Workflow
 This study investigated whether several common species of bats showed decreased activity adjacent to three large highways near San Francisco Bay. Activity in this study was defined as the number of ultrasonic foraging calls recorded by autonomous acoustic detectors. The core tasks involved collecting raw bat call data using the detectors, extracting specific features of the recorded calls, classifying the calls to the species level, and performing statistical analysis on the resulting nightly call counts as a function of predictor variables, including distance from the road. The complete analysis is described in a manuscript published in PLoS ONE in 2014. We later used a similar workflow to conduct a second study, published in Agriculture, Ecosystems & Environment, of the predictors of bat activity in vineyard landscapes.
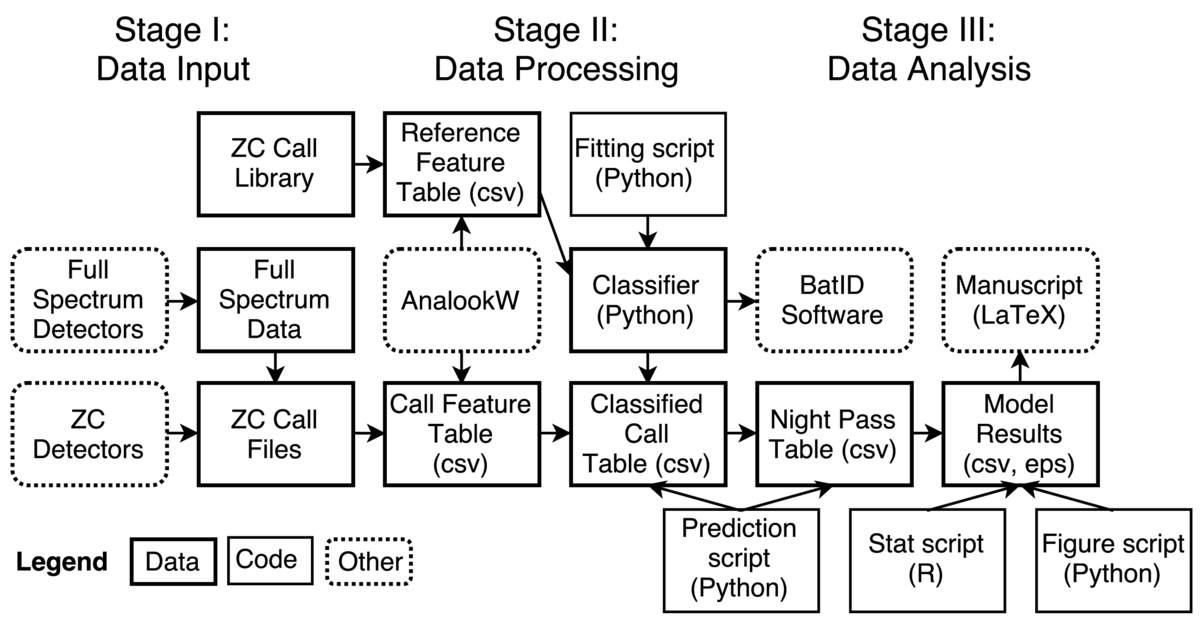
Two different types of acoustic detectors were used, one of which recorded data in zero-crossing format and the other in full spectrum format. The full spectrum data were converted to zero-crossing format using a closed-source utility provided by the detector manufacturer, with conversion parameters selected to produce output similar to the recordings from the native zero-crossing detector. The free, closed-source software AnalookW, developed by an individual researcher who has been active for many years in bat call analysis, was used to filter out files containing only noise and, for the remaining files containing bat calls, extract twelve features describing each call. These features were saved in a csv table.
The calls were then classified by species, which was done using a random forest classifier. A reference library containing zero-crossing calls made by individual bats identified in hand was obtained from a personal contact, and the same twelve features were extracted for these calls using AnalookW. A random forest classifier was trained on this data using the Python package scikit-learn v0.12. Classifier accuracy was evaluated using cross validation and a confusion matrix.
The classifier was then used to identify the recorded calls to the species level, creating a classified call table. This table was summarized into a nightly pass table, which aggregated the calls into passes consisting of multiple, closely spaced calls and summarized the number of passes of each species recorded in each night, at each distance from the road. Environmental and site variables were joined to this pass data to create the final table for statistical analysis.
As functions for fitting generalized linear mixed models (GLMMs) were not available in Python, statistical analysis was carried out in R. Exploratory analysis showed that a Poisson regression was not appropriate for the data, so a negative binomial GLMM was fit to the nightly counts of passes from all species and separately for four common species. The model results were saved as a table that later appeared in the final manuscript. The model result table was then read by a Python script, which created and saved a figure that appeared in the final manuscript. The final manuscript was written in LaTeX and submitted to journals in that format.
In addition to the manuscript, a second output of this project was the open source software BatID, which bundled the classifier object with a browser-based interface to enable non-programmers to automatically classify California bat calls. This software is freely available for download and has been used by researchers in academia, government, and the private sector.
Pain points
At the beginning of the workflow, two closed-source graphical programs had to be used, one to convert a proprietary data format to the zero-crossing format and the second (AnalookW) to perform feature extraction on the zero-crossing call files. Both of these steps required parameters to be entered into these programs, which I was careful to document manually, as this information can otherwise easily be lost. AnalookW runs only on Windows, which required me (and any analysts wishing to use my later software BatID) to locate a Windows computer to complete this step. Although I write code faster and more accurately in Python, I needed to switch to R for statistical analysis, as the necessary packages were not (and still are not) available for Python. A major headache at the manuscript stage arose because the R statistical functions reported output only as a non-machine-readable text file or as an object, which required me to create the final table, containing coefficients and standard errors for 14 variables across 5 models, by hand.
Once I created and released the BatID software, a problem immediately arose when the scikit-learn package was updated to v0.13, which could not read the classifier object created during my analysis. Additionally, the original BatID package required a user to install a full scientific Python stack, a task that proved difficult for precisely the audience of non-programmers that I was hoping to reach. I eventually used pyinstaller to create a standalone binary executable for Windows, reasoning that users of the software needed a Windows computer anyway in order to run AnalookW as a prior step in the analysis. Creating this distributable binary was not straightforward and took many days of trial-and-error testing and manual tuning.
Key benefits
Of all aspects of the analysis, I am particularly happy about the effort that I put in to creating the BatID standalone classifier software. As the many of my colleagues in ecology are non-programmers or novice programmers, I believe that these types of user-friendly tools are critical to advancing the state of science in my field, as well as to supporting the uptake of new methods by non-profit and agency scientists. I hope that more of my computationally-oriented colleagues will engage in similar activities in the future.
Ironically, of course, in creating a tool for non-programmers, I also created another graphical program that cannot easily be scripted into a workflow such as the one. I attempted to ameliorate this concern in the most recent BatID version by requiring users to create a text file containing all parameters, which is read by the program along with the data file, and having the program save all results in the same directory as the parameter file, along with a log file. This at least ensures that there is, by default, some record of the program version, time, and parameters used to process the raw data into classified results tables.
Questions
What does "reproducibility" mean to you?
I consider a study to be (computationally) reproducible when I can send a colleague a zip file containing my raw data and code and he or she can push a single button to create all of the results, tables, and figures in my analysis. It can, of course, be quite challenging to achieve this goal with anything short of the simplest scientific workflows.
Why do you think that reproducibility in your domain is important?
I think that reproducibility is particularly important in fields like ecology in which researchers are striving to make increasingly detailed inference and predictions using relatively scarce data. Although I do not have specific evidence to this effect, it seems logical to me that in these "high leverage" types of analyses, small analytical decisions (how data are cleaned, the options passed to optimizers, etc.) could play a disproportionate role in influencing the eventual study conclusions, and thus need to be fully documented and shared. An easy way to guarantee that all of these decisions are recorded is to make one's entire analysis reproducible by others. More broadly, I feel strongly that reproducibility is a basic component of good science. Now that "doing science" requires communicating more detail than can be easily expressed in narrative form in a manuscript, releasing code and data seems completely necessary, where feasible, across all domains.
How or where did you learn about reproducibility?
I started learning these tools through workshops, in particular by taking Python workshops at UC Berkeley and by teaching Software Carpentry workshops with other experienced instructors. I also learned a great deal by working closely for several months with a former student in my Ph.D. lab who had previously worked at Microsoft. I picked up more advanced techniques and ideas mostly through web searches while attempting to get unstuck from issues that arose in my own research and software development.
What do you see as the major challenges to doing reproducible research in your domain, and do you have any suggestions?
A major challenge in ecology continues to be data sharing and access. Many field ecologists, understandably, are reluctant to share their hard-won raw data with other researchers. I suspect that this caution arises both from a sense of professional necessity (i.e., I invested a ton of time collecting this data and I am going to be the one to publish all of the analyses using it) and from the feeling that numbers alone cannot possibly capture all the subtle nuances that were observed in the field and that are important to truly understanding the data, its potential, and its limitations. In particular, information about sampling bias (as derived from choices of study site, sampling techniques, season, missing data, and many other factors) cannot always easily be described in numeric form. I also suspect that many field ecologists recognize that this information often isn't even in any published manuscript, leaving the person who collected the data as arguably the only one truly qualified to analyze it. What data is published and available tends to be relatively small and of heterogeneous format, and thus is often locked up in printed pdf tables and other non-machine-readable formats.
What do you view as the major incentives for doing reproducible research?
I'm not sure that there are any major external incentives in my field -- certainly, in principle, releasing reproducible research could increase the number of researchers who end up citing your manuscript, but this seems somewhat indirect. Some journals, like PLoS, are now mandating that all novel computer code be uploaded as manuscript supporting information, but it seems that this requirement is not thoroughly checked at this point.