A Reproducible Neuroimaging Workflow using the Automated Build Tool make
Tara Madhyastha, Natalie Koh and Mary K. Askren
We are Tara Madhyastha, Natalie Koh and Mary K. Askren, affiliated with the Integrated Brain Imaging Center (Radiology). In this project, we use functional magnetic resonance imaging (fMRI) to interrogate the function of the brain in elderly individuals to understand how physiological changes relate to mild cognitive impairment and might be predictive of dementia. Specific challenges to processing fMRI data are that the number of steps involved are complicated and can have significant impact on the results, and to achieve the best results, components from many different software packages must be combined. To do this, we need to structure our own pipelines and quality assurance. Data produced using this workflow are visualized in Bach et al. (2016).
Workflow
 One of the major advances of systems neuroscience in the last two decades is the discovery that, at rest, the correlations of the blood oxygen level-dependent (BOLD) signal in cortical regions of the brain (measured non-invasively using fMRI) describe large-scale networks. These networks are altered in a variety of psychiatric and neurodegenerative disease; however, accurate measurement of networks is difficult in part because of a variety of artifacts, including subject motion.
The purpose of this workflow is to preprocess fMRI data for 54 subjects, examining the quality of the data, and generating time series of specific regions of interest. An earlier version of this pipeline (with less exhaustive quality assurance and with a different algorithm for aligning subjects to a standard template) was used to compare a traditional and an improved method for noise removal, generating time-varying correlation matrices for input to an exploratory visualization paradigm. The current preprocessing pipeline supports many primary analyses that are in progress.
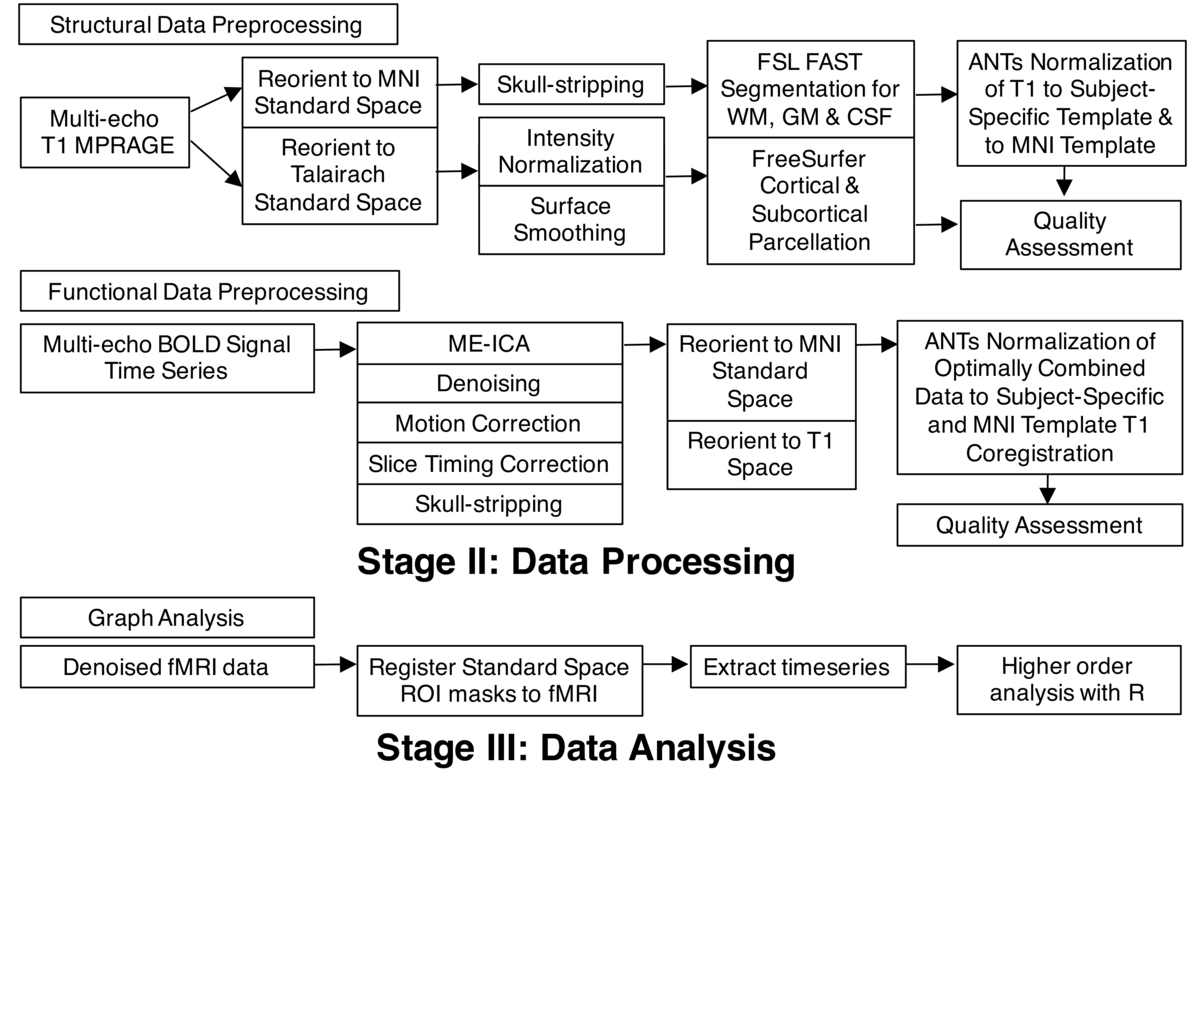
Preparation of data for functional connectivity analyses involved the preprocessing of both structural and functional data using a combination of open source neuroimaging toolkits that run in the UNIX environment (Debian Wheezy). These programs include FSL , FreeSurfer, Advanced Normalization Tools (ANTs) and Analysis of Functional Neuroimages (AFNI). While the details of this processing, described below, are not necessarily important to understanding this case study, the important point is that best practice processing of neuroimaging data requires multiple steps to be performed using different software packages, and a complete reporting of the details involved in these steps is crucial for reproducibility.
Structural data was processed in two ways. First, we used the high resolution structural image to align the lower-resolution functional image (anatomical-functional co-registration). We also used ANTs nonlinear registration to create a study-specific template for all structural images. Second, we used FreeSurfer to create a cortical/sub-cortical parcellation of the brain. Functional data was preprocessed using multi-echo independent components analysis, or ME-ICA (using AFNI’s meica.py script; see Kundu, Inati, Evans, Luh, & Bandettini (2012)). Removal of sources of noise in fMRI data is a huge issue, and the ME-ICA uses fMRI images acquired with different parameters (echo times) to automatically classify sources of variation in the fMRI data as BOLD-related or noise, producing a denoised dataset. It also produces an "optimally combined" image that can be denoised using more traditional techniques. ME-ICA also performs the standard steps of skull-stripping (removal of non-brain tissue from the image) and correction for motion and timing of the acquisition of different slices. The optimally combined output from ME-ICA was aligned to Montreal Neurological Institute (MNI) standard space via the structural registrations and study-specific template defined earlier. Preprocessing steps are fully automated using Make (Askren et al., 2016). Make is a UNIX utility which takes an expression of workflow in the form of target files and their dependencies (a "Makefile") and creates a graph describing what work needs to be done to "make" a target file.
Quality assessment (QA) of preprocessed data involved the manual checking of reports for each study subject comprising images, animated GIFs (data concatenated temporally) and statistics that were generated at both the intermediary and final steps of the workflow. This QA was performed by Natalie Koh, and took approximately 20 minutes per subject. Aberrations and outliers in data were logged in a spreadsheet, and efforts were sometimes made to re-process data that had been flagged for poor quality. Special attention was given to making sure that the skull-stripping for both structural and functional had been performed properly, that registrations were acceptable, and that data had been adequately corrected for motion. Motion, in particular, can significantly bias estimates of time series correlations. As such, motion parameters, statistics and graphs plotting framewise displacement (FD) and delta variation signal (DVARS) over time were looked at carefully to ensure that data was acceptable for further analyses. Ultimately, one subject had to be excluded due to the mean displacement of the subject’s data greatly exceeding the absolute threshold of 2mm. For this subject, motion correction using ME-ICA also failed to correct for movement and the variation in BOLD signal.
Finally, after QA, we extracted the BOLD time series from specific pre-selected regions of interest (ROIs), using the denoised fMRI data and the precomputed and checked spatial normalization to the MNI template. These time series were combined in a comma separated value file and moved to a separate computer for Tara Madhyastha to process using R scripts.
Although this processing pipeline is well set up for us to replicate our own analysis, it is less straightforward to share. Raw data is not currently online, although it will ultimately be archived as part of the Adult Changes in Thought study. All main software to execute the pipeline is available online. However, there are some minor scripts that we have written that are not available online. To fully replicate the pipeline off-site, we would need to supply these scripts and the versions of all software that we used, along with the Makefiles. It would be easiest to do this by supplying a clean copy of the working analysis directory for the subjects from our site, so that the remote site could edit pathnames to specific packages as necessary and rerun our workflow.
Documentation for Makefiles is embedded in our Makefiles either using comments (because we have relatively standardized target names and file naming conventions). We have been recently trying to adopt standards for documentation of naming conventions and help systems. Thus far, however, processing of primary targets has been relatively intuitive and this has not been as important as developing extensive QA and provenance.
Processing is not currently online because the workflows are too computationally expensive to run on a single multicore server, and we often have to trade off disk storage for processing power when deciding where and how to parallelize. We also lack programming resources to develop web-based interfaces for these pipelines. Writing and running the makefiles is less difficult than determining what they should look like, so web-based sharing of workflows has not been a priority.
Pain points
An important part of neuroimaging workflow is checking the quality of automated processing steps. However, when manual corrections are necessary it is less clear how to record them in such a way that they can be completely replicated. We currently maintain a spreadsheet with this information, but clearly corrections introduce problems with reproducibility.
Generating figures for papers can involve significant handwork. For example, to assemble a montage of brain slices that show statistically significant results might involve generating several screen dumps of different coordinates, setting the minimum and maximum manually to be consistent across images that will share a common colorbar. Once the researcher has decided upon the images and coordinates to include, this process cannot always be scripted, and the relevant parameters must be carefully recorded.
Tools such as Rmarkdown and pandoc (or Sweave, odfweave) allow fabulous integration of statistical analysis and text. However, researchers in many labs rely heavily upon Microsoft Word's "track changes" feature to edit papers, making it difficult to entirely couple paper generation and statistical analysis. Thus, there is an unnatural separation of generation of methods text and tables from assembly and editing of the final paper.
Key benefits
Our workflow is unique compared to state-of-the-art in the neuroimaging field because we use Make to describe dependencies. This ensures that only the parts of the workflow that need to be re-executed (because of a failure, or the change to an intermediate result) will be rerun. Practically, avoiding unnecessary computation time is important in neuroimaging workflows that can take many hours or days to run on small clusters of computers. Using scripts written in languages that do not inherently express dependencies (such as bash or Matlab) it is easy to introduce errors when modifiying scripts to execute only uncompleted work.
There are two key advantages of Make over other neuroimaging workflow systems (such as nipype and LONI Pipeline) which also support a dependency graph model. First, Make does not require the core neuroimaging programs to be "wrapped", or surrounded by interface code, that adds development time to the process of designing a workflow and slows adoption of new versions of software programs as they become incompatable with their wrappers. Second, Make builds the dependency graph implicitly from target files, rather than requiring the graph to be drawn or programmed explicitly.
Key tools
There are two key tools that support reproducibility in our workflows. The first is Make, described above. The second is R Markdown, which we use here in combination with Make to generate complex QA reports including statistics, QA images, and graphs generated using R. In workflows not described we use R Markdown to generate data provenance reports suitable for inclusion in a methods section, combining English text describing the workflow with parameters obtained automatically that include software versions and software and scanner acquisition parameters.
Questions
What does "reproducibility" mean to you?
Reproducibility in this context means that given the specifics of the software versions that we are running, our workflow, and the source data, a scientist can obtain the same results from our data that we can.
Why do you think that reproducibility in your domain is important?
Many results in neuroimaging are highly dependent upon the methods used to process the data. It is often the case that scientists discover that some source of noise introduces artifactual findings, or that data that were previously dismissed as noise contain information. Therefore, it is vital to maintain a programmatic description of how data are processed so that findings can be replicated with the same data.
How or where did you learn about reproducibility?
The ideas behind make are from computer science classes. Most other practices described here have been developed together in IBIC based on experience.
What do you see as the major challenges to doing reproducible research in your domain, and do you have any suggestions?
Cognitive neuroscience is an inherently interdisciplinary field, which means that the level of technical skill as well as core domain knowledge varies across researchers within a team. Practices encouraging reproducibility (e.g., scripted workflow) that are second nature to members of one field may be completely novel and a bit intimidating to members of another field. This can lead to slow adoption of best practices.
What do you view as the major incentives for doing reproducible research?
One of the major incentives is that it saves our future selves time trying to figure out what we did after we've forgotten.
Are there any best practices that you'd recommend for researchers in your field?
We recommend automated, scripted workflow as much as possible with minimal hand-editing to avoid human-induced bias (e.g., in boundary editing). Time invested in developing clear, consistent, and maintainable workflow is rarely misspent.
Would you recommend any specific resources for learning more about reproducibility?
The Organization for Human Brain Mapping (OHBM) recently formed a Committee on Best Practices in Data Analysis and Sharing (COBIDAS) to identify best practices of data analysis and data sharing in the brain mapping community. The committee is expected to publish a final report on these practices in the near future, and this may prove to be a useful source for individuals interested in learning about reproducibility in the context of neuroimaging research.
References
Askren, M., McAllister-Day, T., Koh, N., Mestre, Z., Dines, J., Korman, B., … Madhyastha, T. M. (2016). Using make for reproducible and parallel neuroimaging workflow and quality assurance. Frontiers in Neuroinformatics, 10(2).
Bach, B., Shi, C., Heulot, N., Madhyastha, T., Grabowski, T., & Dragicevic, P. (2016). Time Curves: Folding Time to Visualize Patterns of Temporal Evolution in Data. IEEE Transactions of Visualization and Computer Graphics, 22(1).
Kundu, P., Inati, S., Evans, J., Luh, W.-M., & Bandettini, P. (2012). Differentiating BOLD and Non-BOLD Signals in fMRI Time Series Using Multi-Echo EPI. Neuroimage, 60(3), 1759–1770.